TensorBoardでTrainとTestの結果を分けて表示するのに少しハマったのでまとめました。
可視化の意義
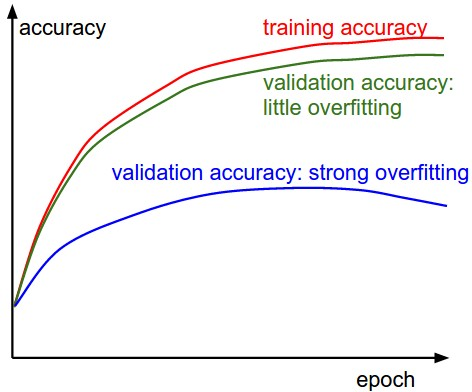
ディープラーニングにおいて、過学習は大きな問題です。Trainのデータに過剰に適応してしまい、Testの精度が乖離することが問題ですが、この状況を把握するためには、学習時のTrainとValidationの精度を可視化してみることが大切です。
TensorFlowにはTensorBoardという素晴らしいツールがあります。TensorBoardのチュートリアルでは、Train時の精度や重み,バイアスなどのヒストグラムを見られるようにするものがあります。しかし今回表示させたい損失関数や、Train, Validationを分けた時の表示のやり方がわからず、少しはまったのでまとめます。
チュートリアルのやり方
基本的には、グラフにしたい変数について、histogram_summaryかscalar_summaryを定義して、ファイルに書き込む形です。
チュートリアルでは、merge_all_summariesというメソッドを用いて、定義されたサマリーを全て追記する形を取っています。TensorBoard関連の必要な部分を書き出すとこんな感じです。
# ヒストグラムサマリーの定義
w_hist = tf.histogram_summary("weights", W)
b_hist = tf.histogram_summary("biases", b)
y_hist = tf.histogram_summary("y", y)

# スカラサマリーの定義
accuracy = tf.reduce_mean(tf.cast(correct_prediction, tf.float32))
accuracy_summary = tf.scalar_summary("accuracy", accuracy)

# 全サマリマージとライター定義
merged = tf.merge_all_summaries()
writer = tf.train.SummaryWriter("/tmp/mnist_logs", sess.graph_def)

# 精度計算とサマリー追加
feed = {x: mnist.test.images, y_: mnist.test.labels}
result = sess.run([merged, accuracy], feed_dict=feed)
summary_str = result[0]
writer.add_summary(summary_str, i)
しかしながらこの方法だと、mergedが走った瞬間に、全ての定義しているサマリーが追記されてしまうため、TrainとValidation, Test等を分けることができません。
もし訓練データ用に
accuracy_summary_train = tf.scalar_summary("train_accuracy", accuracy)
といったサマリを作ったとしても、
feed = {x: mnist.test.images, y_: mnist.test.labels}
result = sess.run([merged, accuracy], feed_dict=feed)
これのおかげで、テストデータの精度計算が走るたびに、全てのサマリを生成してしまうので、訓練データ用のものがテストデータによる計算結果で上書きされてしまいます。
分けてサマリを計算させる
そこで、merge_all_summariesを使わずに、必要なサマリを適宜生成させて追記させていきます。Beginner Tutorialのコードを用い、テスト、検証用に分けて精度、クロスエントロピーを表示させたコードが以下となります。
from tensorflow.examples.tutorials.mnist import input_data
mnist = input_data.read_data_sets("MNIST_data/", one_hot=True)

import tensorflow as tf
x = tf.placeholder(tf.float32, [None, 784])
W = tf.Variable(tf.zeros([784, 10]))
b = tf.Variable(tf.zeros([10]))
y = tf.nn.softmax(tf.matmul(x, W)+b)
y_ = tf.placeholder(tf.float32, [None, 10])

cross_entropy = tf.reduce_mean(-tf.reduce_sum(y_ * tf.log(y), reduction_indices=[1]))

# ヒストグラムサマリーを定義
w_hist = tf.histogram_summary("weights", W)
b_hist = tf.histogram_summary("biases", b)
y_hist = tf.histogram_summary("y", y)

#  精度計算
correct_prediction = tf.equal(tf.argmax(y,1), tf.argmax(y_,1))
accuracy = tf.reduce_mean(tf.cast(correct_prediction, "float32"))

with tf.name_scope("train") as scope:
    train_step = tf.train.GradientDescentOptimizer(0.5).minimize(cross_entropy)
    acc_summary_train = tf.scalar_summary("train_acc", accuracy)
    loss_summary_train = tf.scalar_summary("cross_entropy_train", cross_entropy)

with tf.name_scope("val") as scope:
    acc_summary_val = tf.scalar_summary("val_acc", accuracy)
    loss_summary_val = tf.scalar_summary("cross_entropy_val", cross_entropy)

init = tf.initialize_all_variables()
sess = tf.Session()
sess.run(init)

writer = tf.train.SummaryWriter("data", sess.graph_def)

# 学習
for i in range(1000):
    batch_xs, batch_ys = mnist.train.next_batch(100)
    sess.run(train_step, feed_dict={x:batch_xs, y_:batch_ys})

    # 10回に1回をグラフにする
    if i%10==0:
        train_list = [accuracy, acc_summary_train, loss_summary_train, w_hist, b_hist, y_hist]
        result = sess.run(train_list, feed_dict={x:batch_xs, y_:batch_ys})
        for j in range(1,len(result)):
            writer.add_summary(result[j], i)
        print("Train accuracy at step %s: %s" % (i, result[0]))

        val_list = [accuracy,acc_summary_val, loss_summary_val]
        result = sess.run(val_list, feed_dict={x:mnist.validation.images, y_:mnist.validation.labels})
        for j in range(1,len(result)):
            writer.add_summary(result[j], i)

        print("Validation accuracy at step %s: %s" % (i, result[0]))
ポイントとしては、セッション内で精度を計算する際に、対象データで生成したいサマリーを指定するだけです。
train_list = [accuracy, acc_summary_train, loss_summary_train, w_hist, b_hist, y_hist]
result = sess.run(train_list, feed_dict={x:batch_xs, y_:batch_ys})
これで以下のように、過学習しているかそうでないかをグラフで確認することができます。
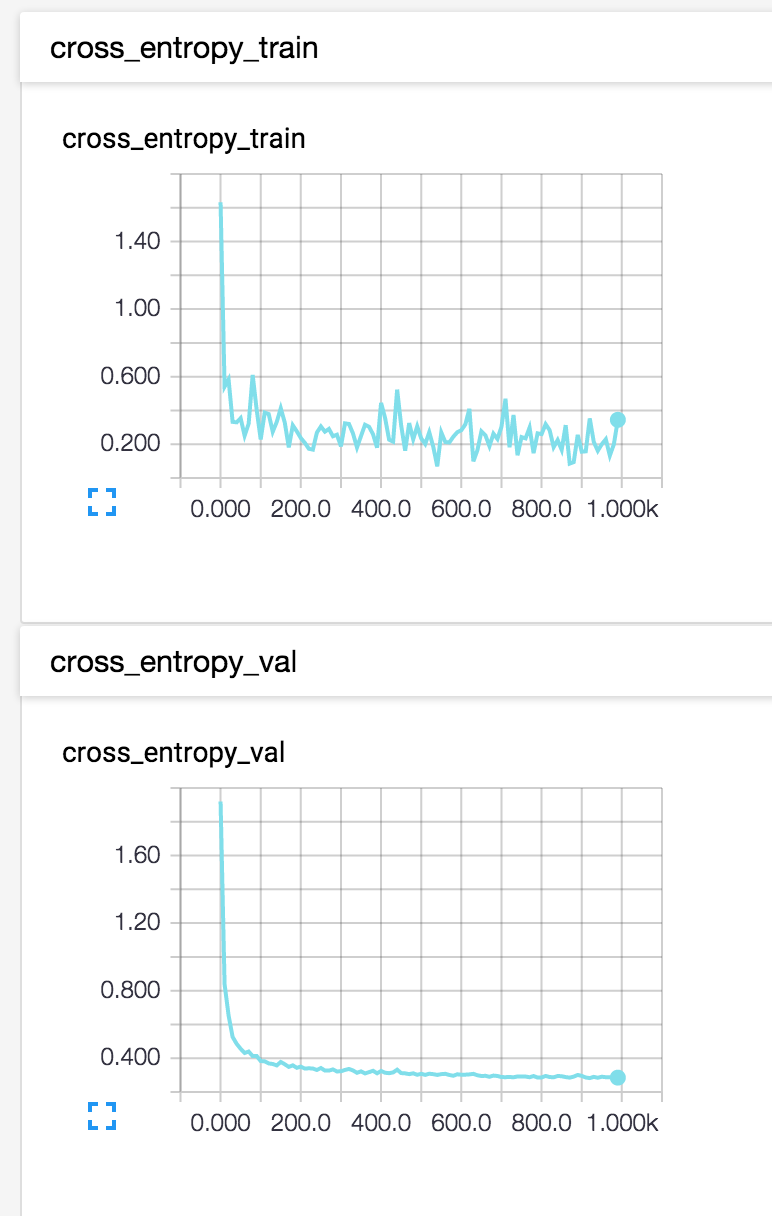
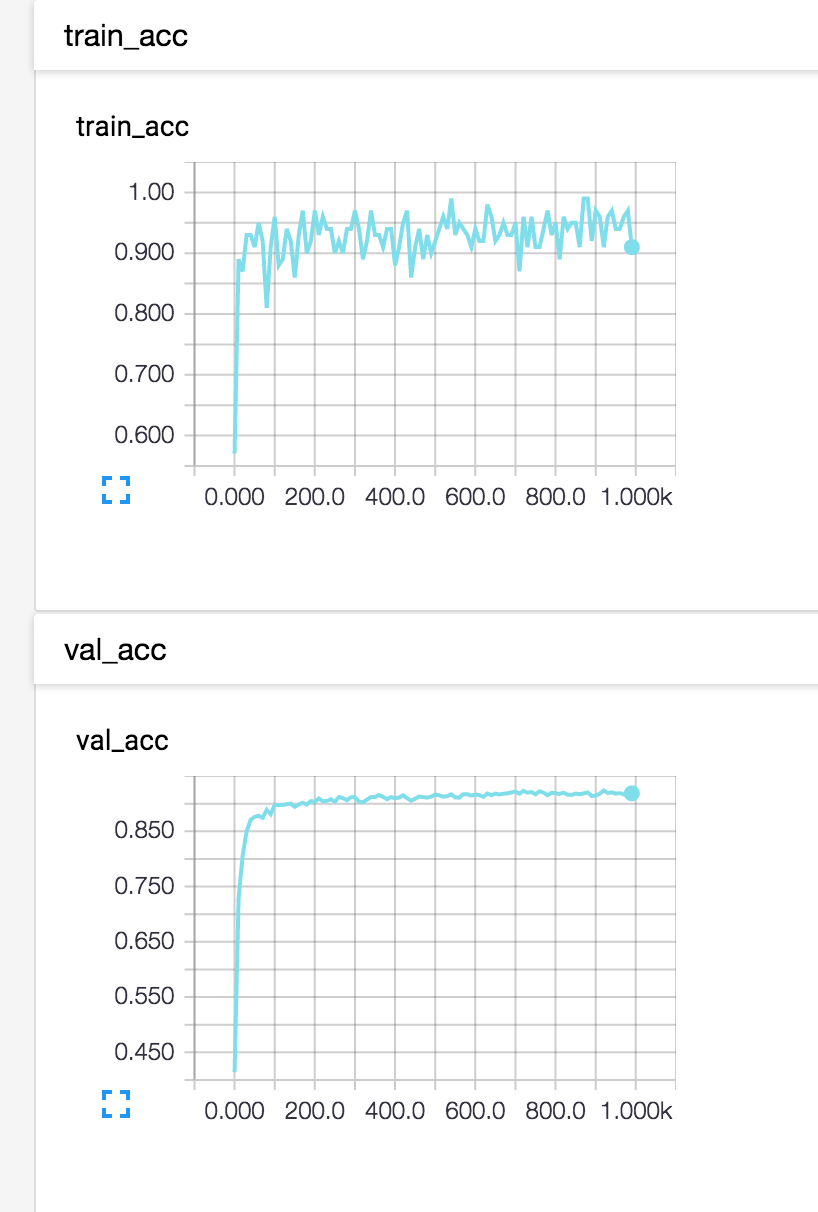
まあMNISTではなかなか過学習はおきませんが、複雑なモデルになってくるときに重宝しそうです。