概要
Zabbixのデータをソースとして、Grafanaでサーバの状態を可視化できるgrafana-zabbixのインストール〜初期設定までの手順です。
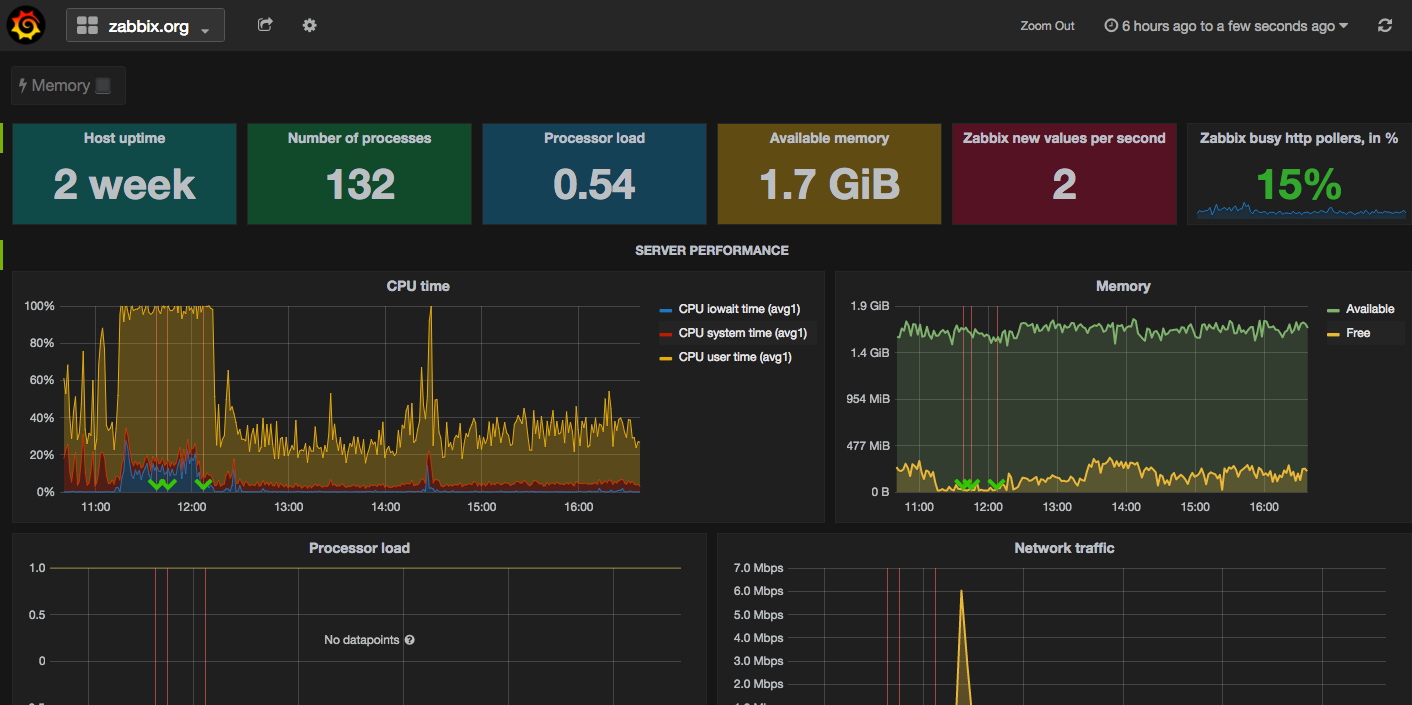
http://play.grafana-zabbix.org/ にオンラインのデモ環境があります。
とてもステキな感じです。
環境
すでにZabbixサーバ(2.4系)がインストールされているCentOS6上で構築しました。
Zabbixサーバは2.2系以下だと設定が若干異なるようです。
https://github.com/alexanderzobnin/grafana-zabbix/wiki/Installation#note-for-zabbix-22-or-less
Grafanaは未インストールの状態です。今回は2.0系を使います。
インストール
Grafanaインストール
grafana2.0系をインストールします。
yum install -y fontconfig
wget https://grafanarel.s3.amazonaws.com/builds/grafana-2.0.2-1.x86_64.rpm
rpm -ivh grafana-2.0.2-1.x86_64.rpm
service grafana-server start
grafana-zabbixのインストール
wget https://github.com/alexanderzobnin/grafana-zabbix/archive/v2.0.0.tar.gz
tar zxvf v2.0.0
mv grafana-zabbix-2.0.0/zabbix /usr/share/grafana/public/app/plugins/datasource/
zabbixへGrafana用ユーザー追加
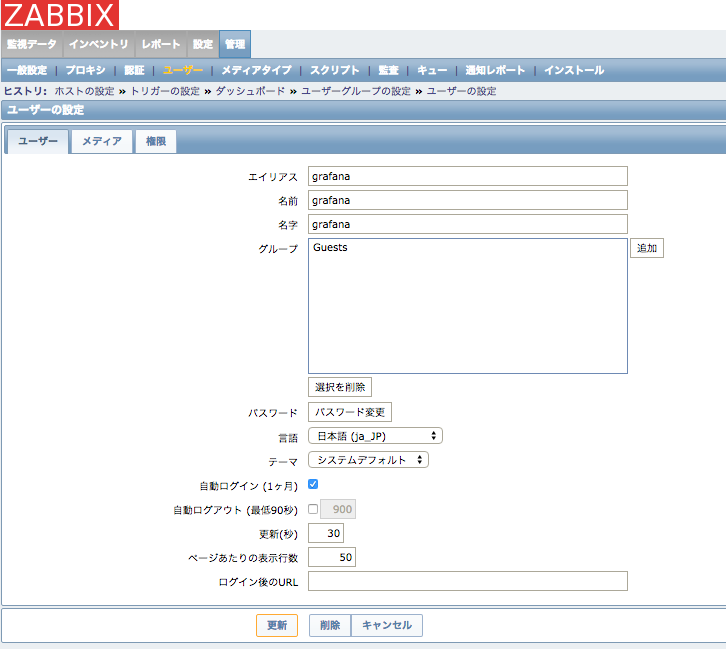
zabbix上で、grafana連携用のユーザーを作成します。
Grafanaで表示させたいサーバの読み取り権限が必要です。
ここでは
ユーザー名:grafana
パスワード:passwd
とします。
作成したユーザー情報を設定ファイルに記述して、Grafanaを再起動します。
vi /usr/share/grafana/public/app/plugins/datasource/zabbix/plugin.json
-----
:
  "username": "grafana",
  "password": "passwd",
:
-----

/etc/init.d/grafana-server restart
ダッシュボード設定
ブラウザでGrafanaにログインします。
デフォルトでは3000番ポートで起動します。
http://servername:3000
初期状態では。admin/adminでログインできます。
左ペインの[Data Sources]から[Add New]を開いて、Zabbixサーバをデータソースとして登録します。
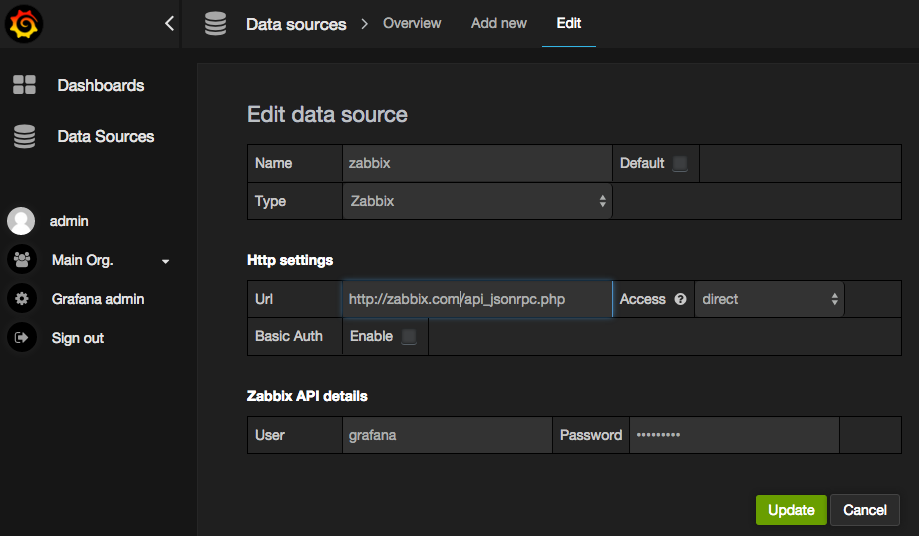
NameとTypeをZabbixとします。
Urlは、zabbixサーバのAPI(api_jsonrpc.php)のURLを入力します。
Accessはdirectに変更します。
ZabbixAPIdetailsにZabbixサーバで作成したGrafana用ユーザーの情報を入力します。
これで設定は完了です。
ダッシュボード作成
新規でダッシュボードを作るには、トップページからHomeを開き、Newボタンをクリックします。
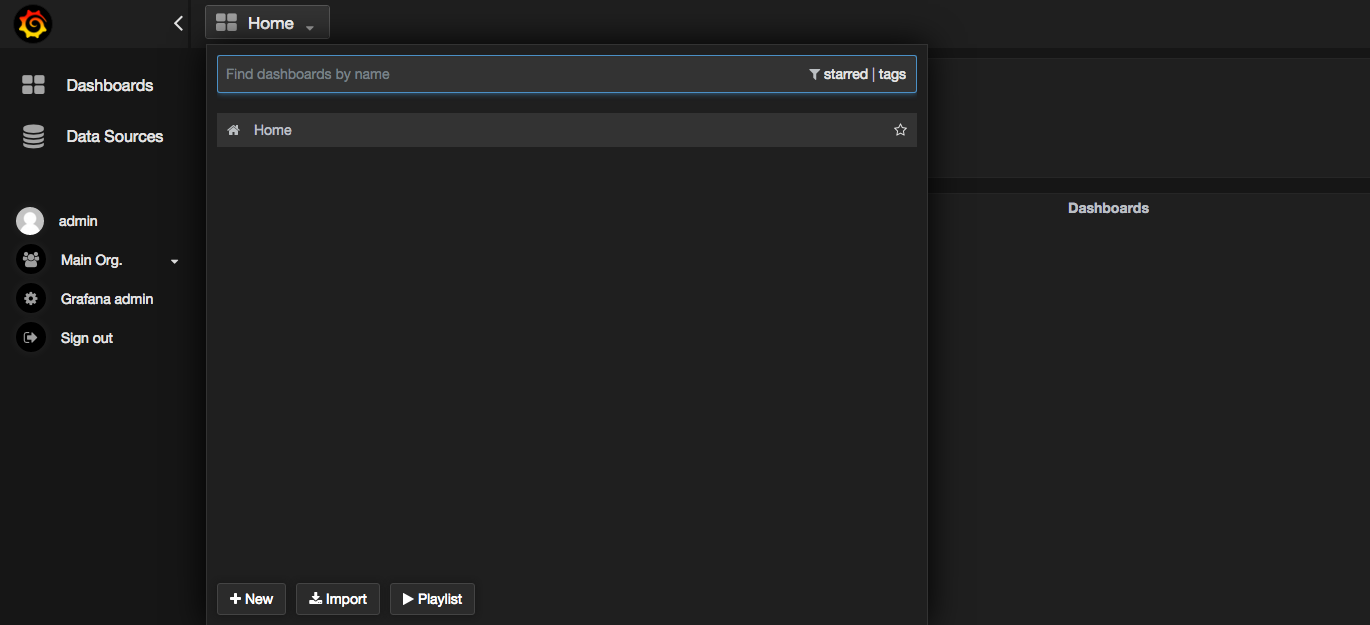
すると空のダッシュボードが作成されます。
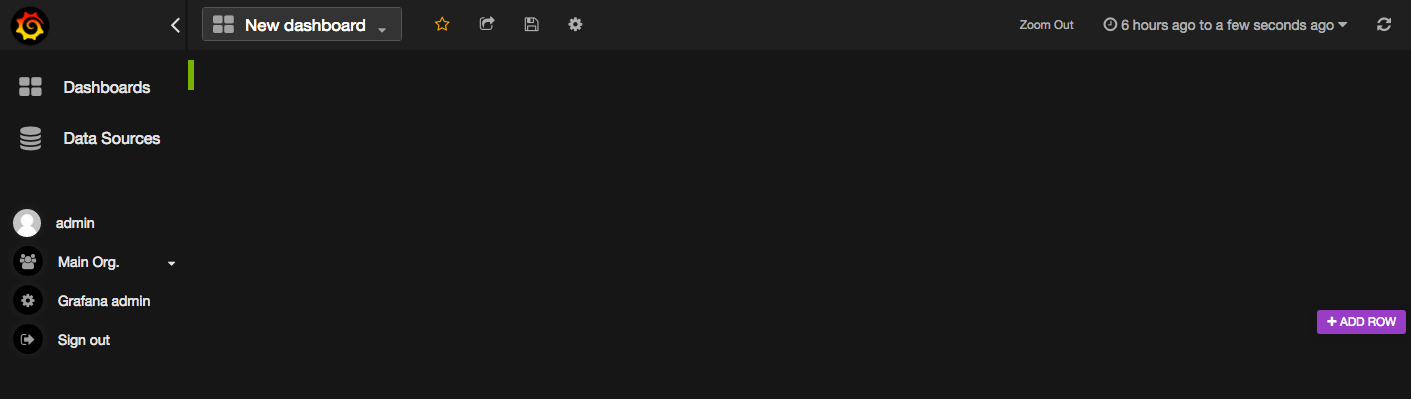
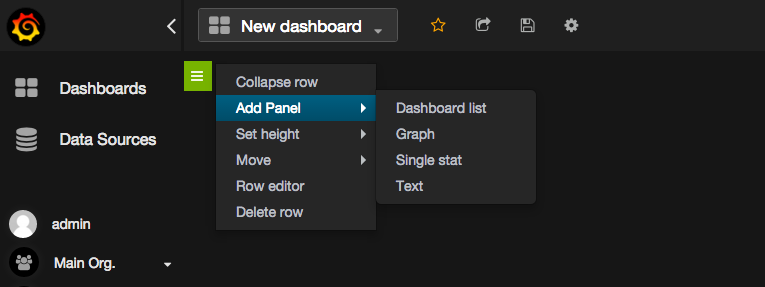
緑色のバーをクリックするとAddPanelから項目を追加できます。(ここではgraphで作成します)
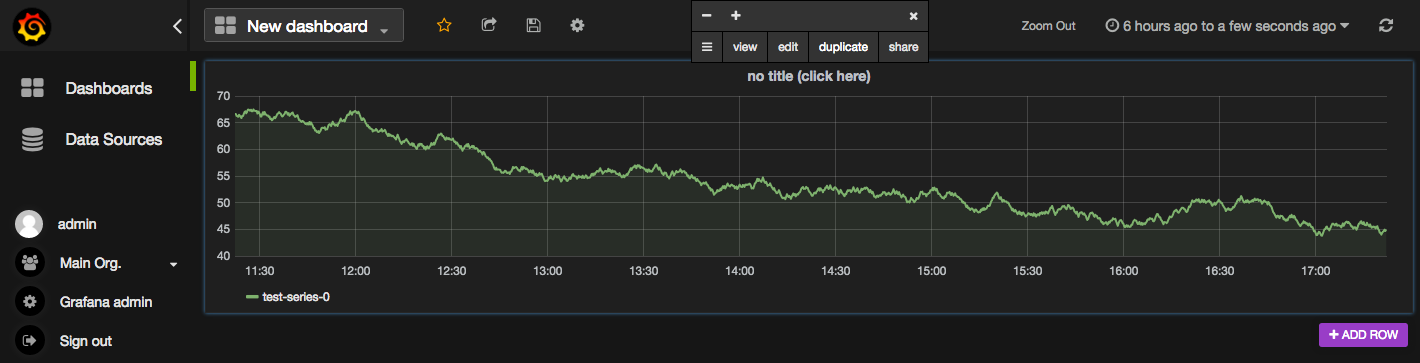
グラフの雛形が作成されますので、タイトル(no titleの部分)からeditをクリックします。
Metricsのタブの下部にあるデータソースをzabbixに変更すると、zabbixの監視パラメーターが選択できるようになります。
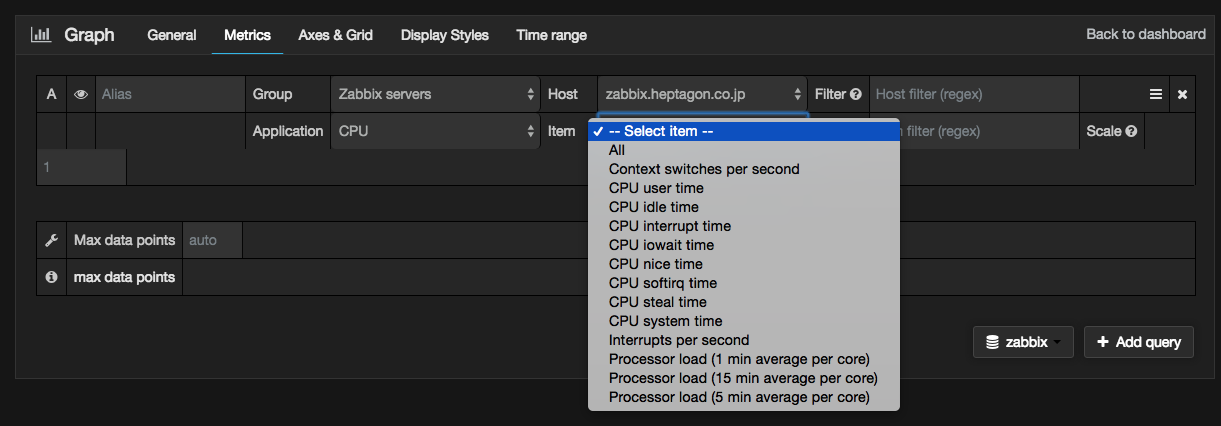
あとは、通常のGrafanaと同じように設定していけば、お好みのダッシュボードが作成できると思います!
API経由だからか表示がちょっと重いかなという印象です。