Q.
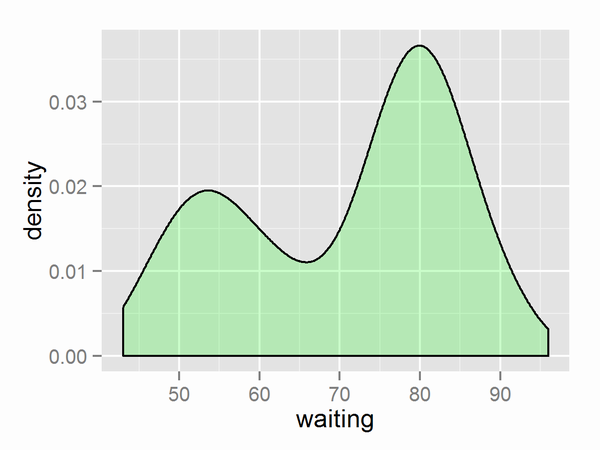
以下のようにgeom_densityを使って確率密度関数を描くと端が切れちゃいます。これだと積分して1になっていないし、なんか気持ち悪いのでやめさせたいのですが。
NG_example.R
library(ggplot2)

ggplot(faithful, aes(x=waiting)) +
  geom_density(fill='green', alpha=0.2)
A.
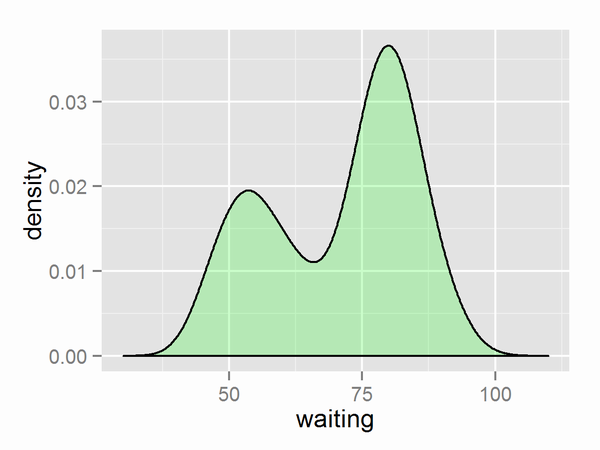
以下のようにxlimを追加すればOKです。
OK_example1.R
library(ggplot2)

ggplot(faithful, aes(x=waiting)) +
  geom_density(fill='green', alpha=0.2) +
  xlim(30, 110)
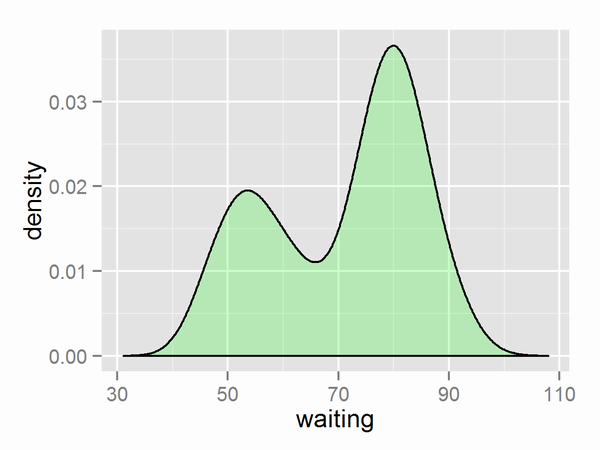
範囲を手動で決めるのが嫌ならdensity関数で求めてそのrangeを使うのがよいでしょう。二度手間ですが。
OK_example2.R
library(ggplot2)

dens <- density(faithful$waiting)
ggplot(faithful, aes(x=waiting)) +
  geom_density(fill='green', alpha=0.2) +
  xlim(range(dens$x))
参考情報
もともとの回答は@kohskeさんにslackで教えてもらいました。
https://r-wakalang.slack.com/messages/ggplot2/
回答を元に検索し、下記のStackOverFlowの質問をもとにこの記事を書きました。コードはほぼ引用です。
http://stackoverflow.com/questions/28698852/adjusting-x-limits-xlim-in-ggplot2-geom-density-to-mimic-ggvis-layer-densiti