This article is English version of this one.
In this article, I'd like to introduce how to visualize your RRD file data with Grafana. It's simpler way than migrating all data to something time series database like InfluxDB. Explanations of each operation are based on CentOS.
RRDtool
In general, RRDtool is used to generate images of graph for MRTG. But it supports JSON data export in ver. 1.4.6 or later. I used ver. 1.5.6 in this time.
Grafana
Grafana support various time series database like Graphite, OpenTSDB, InfluxDB and so on. In addition, we can install plugins to support additional data sources. One of those plugins is SimpleJSON. We can get JSON data from designated URL, and show it in graph on Grafana.
Grafana RRD Server
This is a simple HTTP server written in GO. It can receive requests from above SimpleJSON, load data from RRD file and respond that data in JSON format.
Then, I describe concrete procedure in below:
Building RRDtool(MRTG) environment
Let me omit detail about this because I think many good articles are already written about this topic. Anyway, it's ok if your data is stored in RRD files.
Installation of net-snmp
yum install net-snmp net-snmp-utils
About configuration, this article is helpful.
Installation of RRDtool
Although yum (or deb) package is available, old version don't support JSON data export. So download tar ball from following, compile and install manually.
Installation guide also can be found here.
Installation of MRTG
How to install MRTG
https://oss.oetiker.ch/mrtg/doc/mrtg-unix-guide.en.html
https://www.server-world.info/en/note?os=CentOS_7&p=mrtg
How to use RRDtool with MRTG
https://oss.oetiker.ch/mrtg/doc/mrtg-rrd.en.html
In addition, as being explained in above, also CGI script also is needed to generate image from RRD file.
14all.cgi
http://my14all.sourceforge.net/
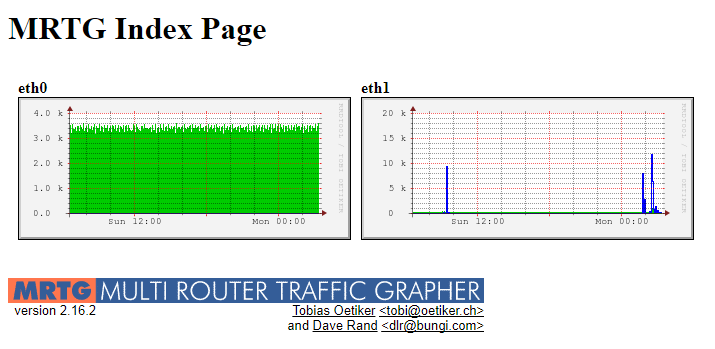
Now you should be able to access to http://(hostname)/mrtg, and see MRTG well-known graphs like followings:
Installation of Grafana RRD server
Grafana RRD server also needs RRDtool. If you install it on the same host which we built by the above procedure, RRDtool has already installed. But if you want to use another host (e.g. you've operated MRTG and RRDtool already and want to use those RRD files), you should check the version of RRDtool. And if it's older than ver. 1.4.6, you need to install newer version. Be careful to break your system by over writing running RRDtool.
You can check the version of RRDtool in your host when you execute it without any options.
$ rrdtool
RRDtool 1.5.6  Copyright by Tobias Oetiker <tobi@oetiker.ch>
               Compiled Jul 12 2017 04:55:38

Usage: rrdtool [options] command command_options
Valid commands: create, update, updatev, graph, graphv,  dump, restore,
		last, lastupdate, first, info, fetch, tune
		resize, xport, flushcached

RRDtool is distributed under the Terms of the GNU General
Public License Version 2. (www.gnu.org/copyleft/gpl.html)

For more information read the RRD manpages
Next, we need to install Go. You can find installation guide in their official documents.
Finally, we install Grafana RRD server. In my environment, GOPATH and following ENV variables are needed.
export PKG_CONFIG_PATH=/opt/rrdtool-1.5.6/lib/pkgconfig/
export GOPATH=$HOME/go
In addition, following symbolic link also is needed.
cd /opt/rrdtool/lib/
ln -s librrd.so.4.3.5 librrd.so.4
Then, get the code from Github.
go get github.com/doublemarket/grafana-rrd-server
You can boot the server like this:
$HOME/go/bin/grafana-rrd-server -s 300 -r /var/www/mrtg/ &
By this command, Grafana RRD server will be booted using TCP/9000 port by default. You can find detailed explanation of each option on Github if you need.
Now we are ready to get RRD file data from Grafana.
Installation of Grafana
Grafana is not needed to be installed on the same host with MRTG. You can use another host if it can communicate with Grafana RRD server via TCP port which we configured above.
Install and boot Grafana server
Download package file and install it.
wget https://s3-us-west-2.amazonaws.com/grafana-releases/release/grafana-4.4.3-1.x86_64.rpm
sudo yum localinstall grafana-4.4.3-1.x86_64.rpm
And then, install SimpleJSON plugin.
grafana-cli plugins install grafana-simple-json-datasource
Boot grafana-server service
service grafana-server start
Configuration of Data Source
When you access to http://(hostname):3000, you can see the login screen. You can login with default login credential(admin/admin).

From Grafana icon on top left side, open the menu and click [Data Soueces].
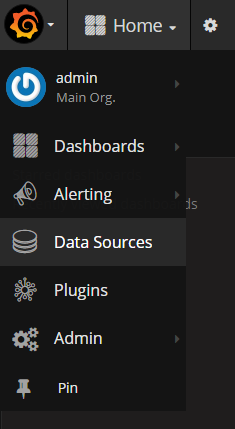 =>
=> 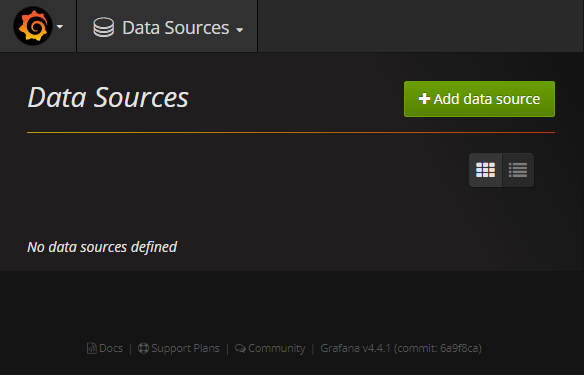
Click [+Add data source] and configure following items:
| Item | Value |
|---|---|
| Name | rrd |
| Type | SimpleJson |
| Url | http://(Grafana RRD server host):9000/ |
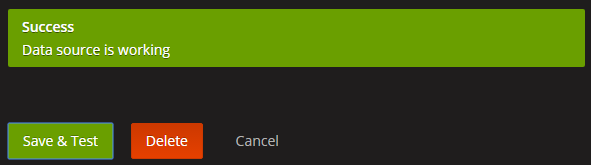
You can see the message "Success" when you click [Save & Test], if everything is OK.
Create Graphs
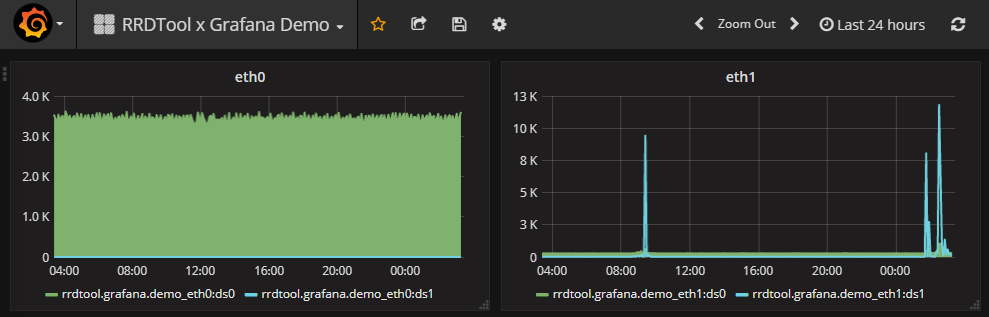
After you create a new dashboard and add a graph panel, configure the panel like following.
- In 'Panel Data Source' pull-down, Select 'rrd' which we created above.
- In 'select metric' of query editor, you can see the list of RRD filename and DS name. Select one of them.
Now the data in selected RRD file is shown in graph panel. You can add 2 or more series of data in a graph by clicking [Add Query].

You can create similar dashboard with MRTG by doing same things again and again.