LoginSignup
4
3

More than 5 years have passed since last update.

正規分布の画像を出力する

Posted at

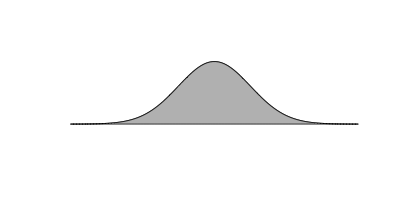
スライドとかで色々使う割に、Powerpoint/Keynoteにオブジェクトが無い正規分布。手で書くと難しいのでRで描く。

png(file="Normal.png", width=400, height=200)
plot(dnorm, -4, 4, ann=F, axes=F)
n  <- 100
xs <- seq(-4, 4, length=n)
ys <- dnorm(xs)

polygon(c(xs,rev(xs)), c(rep(0,n),rev(ys)), col="gray")
dev.off()

Normal.png

4
3
2

Register as a new user and use Qiita more conveniently

  1. You get articles that match your needs
  2. You can efficiently read back useful information
  3. You can use dark theme
What you can do with signing up
4
3