環境
オフィシャルのDocker コンテナを利用して環境を作ります。
バージョン
- Elastic Search 5.1
- Kibana 5.1
- Docker composer 1.8.1
プラグイン
X-Pack
クラスタの状態をKibanaからみられる様に Elastic SearchとKibanaの両方にインストールします。
Elastic Searchのバージョン5以降は 関連プロダクトも含めてElastic Stackとして整備されました。それ以前は有償プラグインとして提供されていた Marvel(モニタリング)、Shield(セキュリティ)、Watcher(アラートと通知)、Graph(可視化) を一まとめにしたものです。
今回はX-Packをインストール後にモニタリングだけを有効にしておきます。
kuromoji
形態素解析のために kuromoji をプラグインからインストールします。
Docker のファイルを準備
利用するファイルの品揃えは下の通りです。
.
┣━━ docker-compose.yml
┣━━ es
┃  ┣━━ Dockerfile
┃  ┗━━ config
┃      ┣━━ elasticsearch.yml
┃      ┣━━ log4j2.properties
┃      ┗━━ scripts (空ディレクトリ)
┗━━ kibana
    ┗━━ Dockerfile
docker-compose.yml
version: '2'
services:
  elasticsearch:
    build: es
    volumes:
        - es-data:/usr/share/elasticsearch/data
        - ./es/config:/usr/share/elasticsearch/config
    ports:
        - 9200:9200
    expose:
        - 9300
    ulimits:
        nofile:
            soft: 65536
            hard: 65536
        # https://github.com/docker-library/elasticsearch/issues/111
        # uliimit
  kibana:
    build: kibana
    links:
        - elasticsearch:elasticsearch
    ports:
        - 5601:5601

volumes:
    es-data:
        driver: local
- コンテナ外からアクセスを行えるように、Elastics Searchの9200番ポートとKibanaの5601番ポートを
portsに指定します。 - システム要件として
nofileを65536することが書かれている のでulimitsで設定を行います。 - Elastics Searchのデータを残すために データボリュームを割り当てます。
- Elastics Searchの設定をカスタマイズするので、設定ファイルを置いてある es/config ディレクトリを マウントします。
es/Dockerfile
FROM elasticsearch:5.1

# x-pack をインストール
RUN elasticsearch-plugin  install --batch x-pack

# kuromojiをインストール
RUN elasticsearch-plugin  install analysis-kuromoji
名前がpluginから変更されたelasticsearch-pluginコマンドで x-packとkuromojiをインストールします。
es/config/elasticsearch.yml
http.host: 0.0.0.0

# Uncomment the following lines for a production cluster deployment
#transport.host: 0.0.0.0
#discovery.zen.minimum_master_nodes: 1

### x-pack functions
xpack.security.enabled: false
xpack.monitoring.enabled: true
xpack.graph.enabled: false
xpack.watcher.enabled: false
オフィシャルコンテナの /usr/share/elasticsearch/config/elasticsearch.yml をコピーして、x-packに含まれる機能の有効/無効(xpack.xxx.enabled)を追加しました。
es/config/log4j2.properties
status = error

appender.console.type = Console
appender.console.name = console
appender.console.layout.type = PatternLayout
appender.console.layout.pattern = [%d{ISO8601}][%-5p][%-25c{1.}] %marker%m%n

rootLogger.level = info
rootLogger.appenderRef.console.ref = console
オフィシャルコンテナの /usr/share/elasticsearch/config/log4j2.properties のコピーです。
kibana/Dockerfile
FROM kibana:5.1

# x-pack をインストール
RUN kibana-plugin install x-pack
プラグインのx-packをインストールします。
ビルドと実行
docker-compose.ymlを置いてあるディレクトリで docker-compose build を行い、成功したら docker-compose upで起動します。
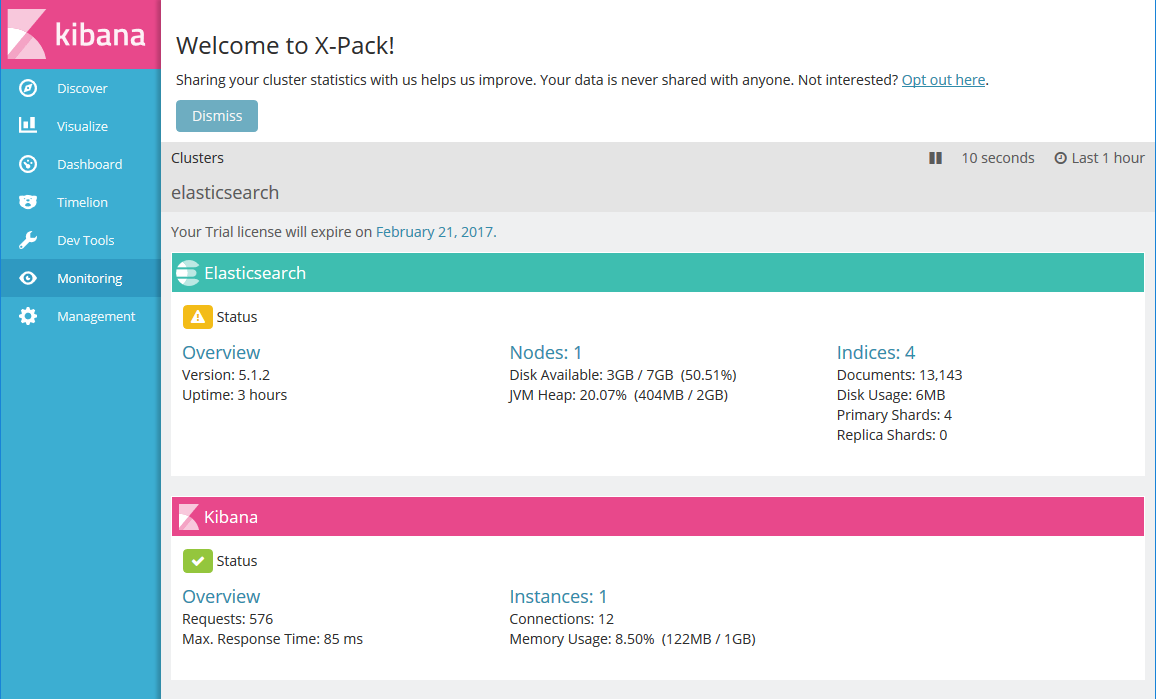
kibana の画面にアクセス
ブラウザで http://serverホスト名orIPアドレス:5601/ でアクセスします。
左側にある「Monitor」を選択すると クラスタの状態を見られます。