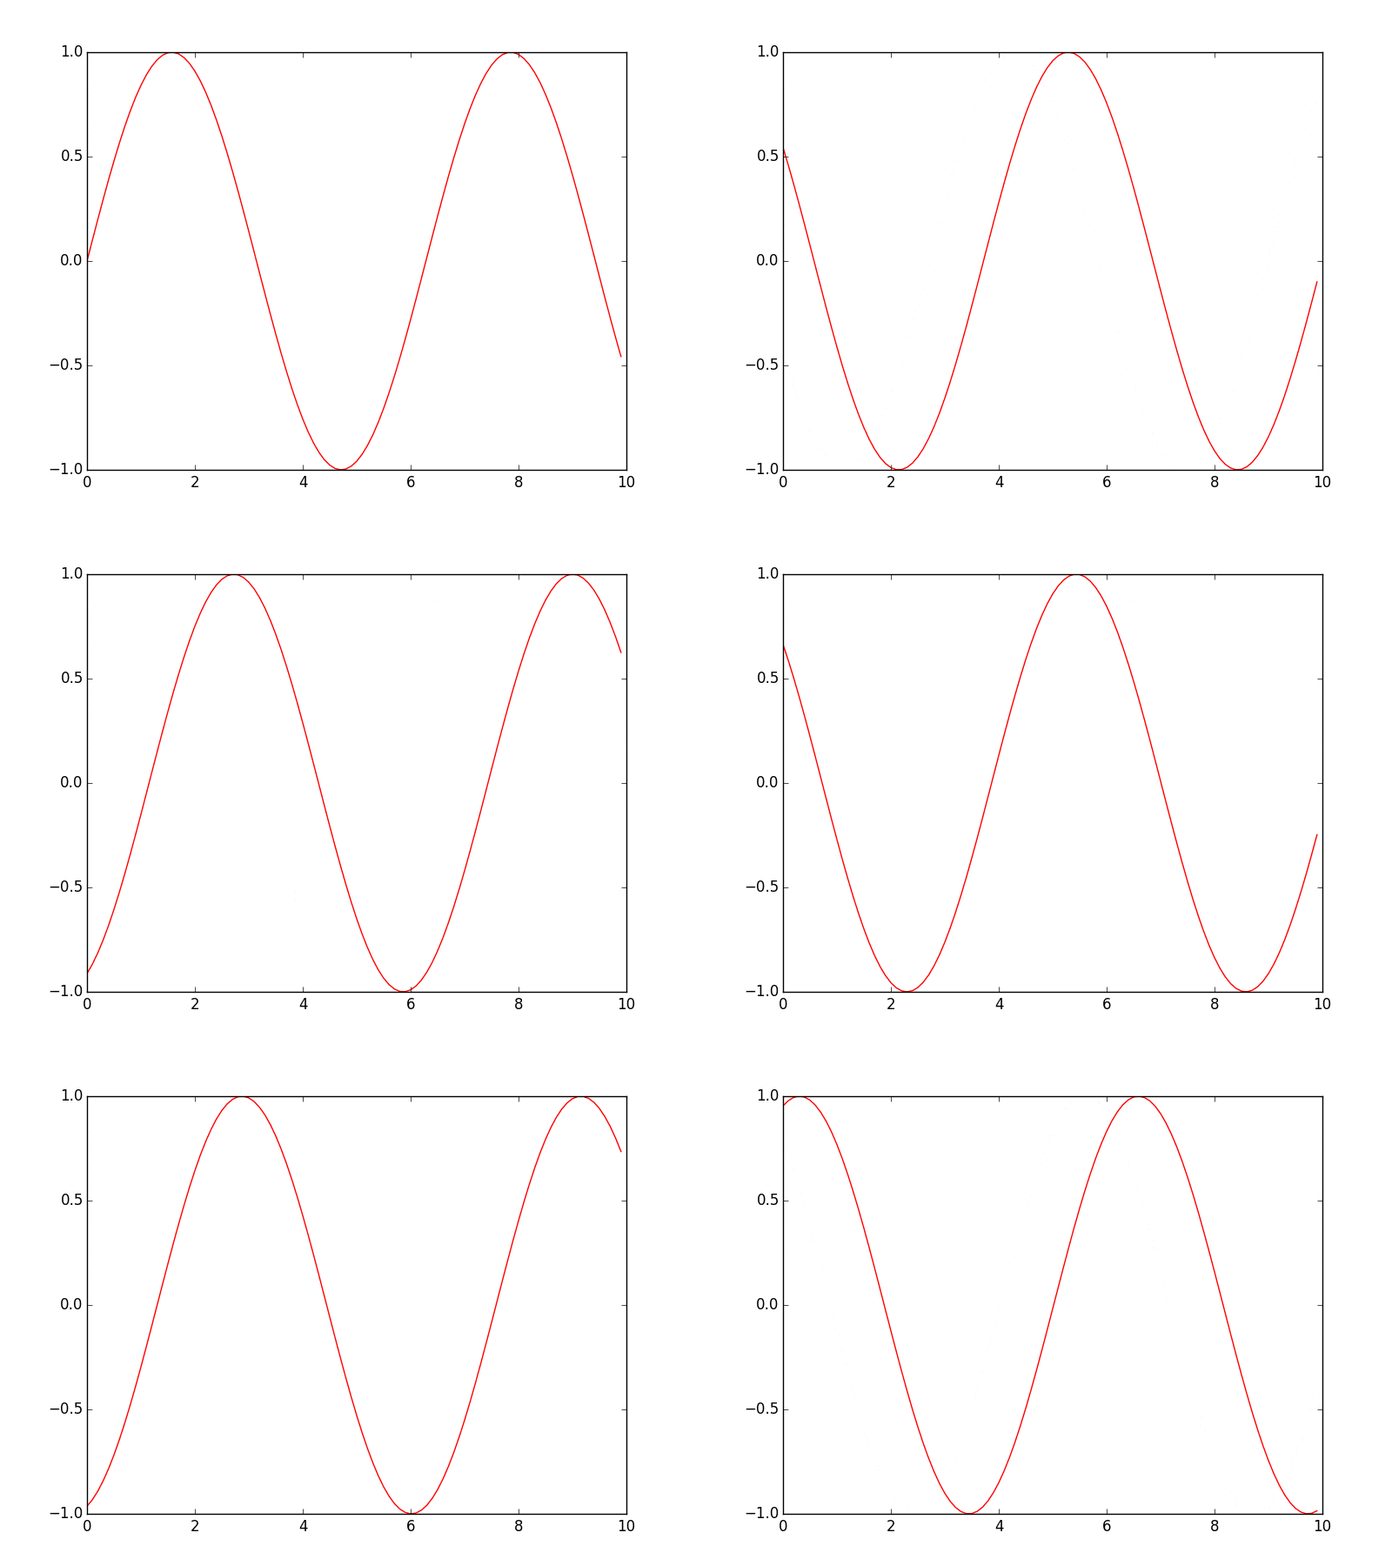
デモ
方法
ここではPythonのグラフ描画ライブラリmatplotlibのanimation.ArtistAnimation関数を使います。流れとしては描画データの配列(ims)を用意し、その配列をanimation.ArtistAnimation関数の第2引数に渡すことでアニメーションを描画しています。
demo.py
import numpy as np
import matplotlib.pyplot as plt
import matplotlib.animation as animation

fig = plt.figure()
x = np.arange(0, 10, 0.1)

ims = []
for a in range(50):
    y = np.sin(x - a)
    im = plt.plot(x, y, "r")
    ims.append(im)

ani = animation.ArtistAnimation(fig, ims)
plt.show()
↓を加えるとアニメーションをgif形式で保存できます。
ani.save("hoge.gif")
参考
pythonで散布図アニメーションを試してみた
http://cflat-inc.hatenablog.com/entry/2014/03/17/214719
