本日は
一番簡単なロジスティック方程式を数値計算して行きませう.
概要
\frac{\mathrm{d}y}{\mathrm{d}x} = y(1-y)
この微分方程式には
y=\sigma(x)=\frac{1}{1+\exp(-x)}
という形の厳密解を持ちます. 深層学習で出てくるシグモイド関数です.
実際,シグモイド関数の微分を計算するとロジスティック方程式の解となることがわかります.
数値計算であればEuler法でも解くことができますので実際に確かめてみましょう.
実装例
import numpy as np
from matplotlib import pyplot as plt
def get_integral_curve(f, init_xy, x_end, delta):
"""
solve ode 'dy/dx=f(x,y)' with Euler method
"""
(x, y) = init_xy
xs, ys = [x], [y]
for i in np.arange(init_xy[0], x_end, delta):
y += delta*f(x, y)
x += delta
xs.append(x)
ys.append(y)
return xs, ys
def main():
"""
solve logistic equation dy/dx=y(1-y)
"""
# set parameters
init_xy = (0, 0.5)
x_end = 5
delta = 0.1
# calc integral curve of logistic equation
f = lambda x, y: y*(1-y)
xs, ys = get_integral_curve(f, init_xy, x_end, delta)
# calc explicit solution
sigmoid_xs = np.arange(-5, 5, delta)
sigmoid_ys = 1/(1+np.exp(-sigmoid_xs))
# plot
fig, ax = plt.subplots()
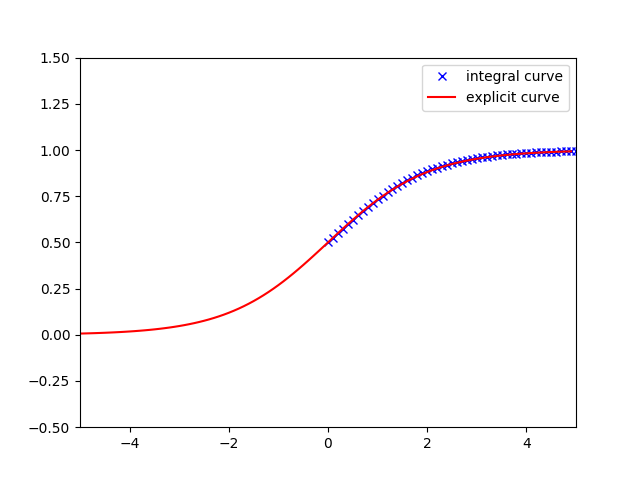
ax.plot(xs, ys, "x", color='blue', label="integral curve")
ax.plot(sigmoid_xs, sigmoid_ys, "-", color='red', label='explicit curve')
ax.legend()
ax.set_xlim([-5, 5])
ax.set_ylim([-0.5, 1.5])
plt.show()
if __name__ == '__main__':
main()
動作例