はじめに
pythonの描画パッケージseabornのChoosing color palettesをまとめたものです。
Jupyterファイルも用意してあります。
準備
%matplotlib inline
import seaborn as sns, numpy as np
from ipywidgets import interact, FloatSlider
color_palette()を用いた作成方法
(Building color palettes with color_palette())
- color_paletteを用いると、ほとんどのカラーパレットを作成できます。
- set_paletteを用いると、デフォルトのカラーパレットを設定できます(例は後述)。
定性的なカラーパレット
(Qualitative color palettes)
- カラーパレット名を指定しないと、現在のカラーパレットが取得できます。(下記は、デフォルトのカラーパレット)
- palplotは、カラーパレットを表示します。
current_palette = sns.color_palette(n_colors=24)
sns.palplot(current_palette)

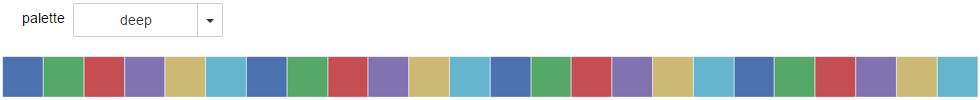
デフォルトのカラーパレットは、6つのテーマ(deep, muted, pastel, bright, dark, colorblind)があります。(デフォルトはdeep)
Jupyterで、テーマをインタラクティブに確認できるようにしました。
def show_pal0(palette):
    sns.palplot(sns.color_palette(palette, 24))
interact(show_pal0, palette='deep muted pastel bright dark colorblind'.split());
色相カラーパレット
(Using circular color systems)
よく使われるのは、hlsです。color_paletteでも、hls_paletteでも作成できます。
sns.palplot(sns.color_palette("hls",24))
sns.palplot(sns.hls_palette(24))

パラメータ l で明度を、s で彩度を指定できます。
sns.palplot(sns.hls_palette(24, l=0.2))
sns.palplot(sns.hls_palette(24, s=0.2))


下記の様にするとくっきりしたカラーパレットになります。
sns.palplot(sns.hls_palette(24, l=0.5, s=1))

Jupyterで、明度と彩度をインタラクティブに確認できるようにしました。
def show_pal1(l, s):
    sns.palplot(sns.hls_palette(24, l=l, s=s))
interact(show_pal1, l=FloatSlider(0.6, max=1), s=FloatSlider(0.65, max=1));

hlsの色相ごとの明度のばらつきを少なくしたhuslも利用できます。
sns.palplot(sns.husl_palette(24))

カテゴリカラー
(Using categorical Color Brewer palettes)
名前のついたカラーパレットです。 少し古いですが、一覧(印刷用PDF)を用意しました。
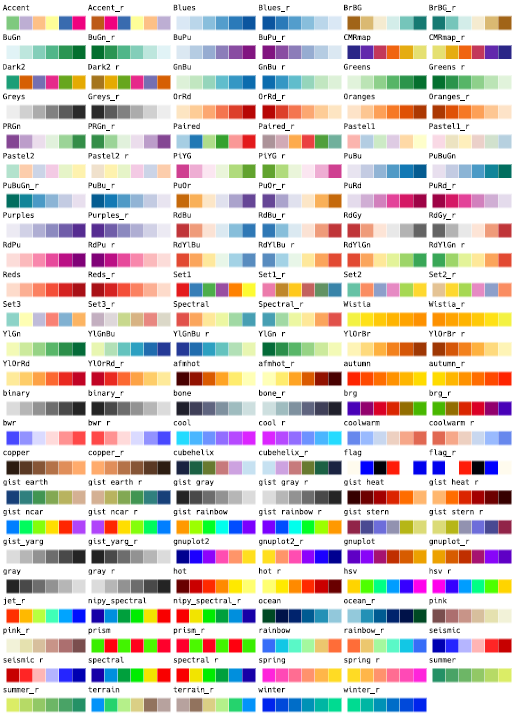
参考:https://matplotlib.org/examples/color/colormaps_reference.html
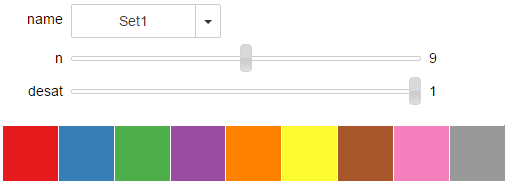
sns.palplot(sns.color_palette("Set1", 24))

Jupyterでは、簡単に確認できます。
sns.choose_colorbrewer_palette('qualitative');
RGBで指定してカラーパレットを作成することもできます。
flatui = ["#9b59b6", "#3498db", "#95a5a6", "#e74c3c", "#34495e", "#2ecc71"]
sns.palplot(sns.color_palette(flatui, 24))

連続カラーパレット
(Sequential color palettes)
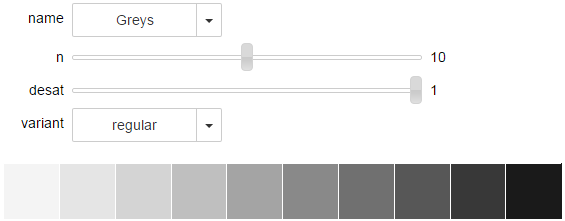
- 特定の名前を指定すると、連続的なカラーパレットになります。
- 名前に"_d"をつけるとdarkになります。(つけないとlight)
- 名前に"_r"をつけると逆順になります。
sns.palplot(sns.color_palette("Blues", 24))
sns.palplot(sns.color_palette("Blues_d", 24))
sns.palplot(sns.color_palette("Blues_r", 24))


Jupyterでは、簡単に確認できます。
sns.choose_colorbrewer_palette('sequential');
cubehelix_paletteを用いた連続カラーパレット
(Sequential palettes with cubehelix_palette())
cubehelixを使って色調を変化させながら、明るさを連続的に変化させたカラーパレットを作成できます。
sns.palplot(sns.color_palette("cubehelix", 24))

cubehelix_paletteは、違うカラーパレットになるようです。
sns.palplot(sns.cubehelix_palette(24))

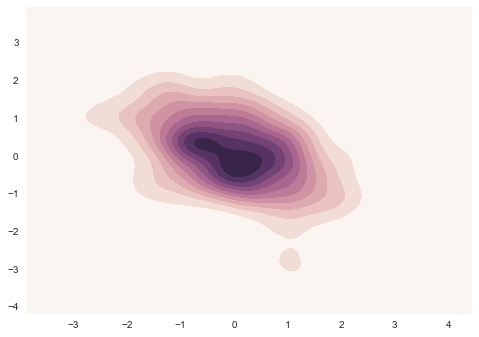
as_cmap=Trueとすることで、cmapパラメータを持つグラフ描画で使えるようになります。
np.random.seed(1)
x, y = np.random.multivariate_normal([0, 0], [[1, -.5], [-.5, 1]], size=300).T
cmap = sns.cubehelix_palette(light=1, as_cmap=True)
sns.kdeplot(x, y, cmap=cmap, shade=True);
Jupyterで、cubehelix_palette カラーパレットをインタラクティブに確認できるようにしました。
def show_pal2(start, rot):
    sns.palplot(sns.cubehelix_palette(24, start=start, rot=rot))
interact(show_pal2, start=FloatSlider(max=1), rot=FloatSlider(0.4, max=1));

カスタム連続カラーパレット
(Custom sequential palettes with light_palette() and dark_palette())
light_paletteやdark_paletteを使うこともできます。
sns.palplot(sns.light_palette("blue", 24))
sns.palplot(sns.dark_palette("blue", 24))


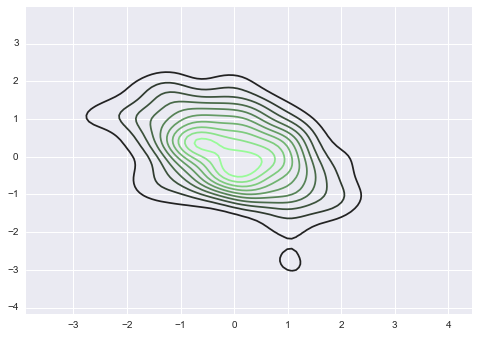
先ほどの図の等高線に使ってみましょう。
cmap = sns.dark_palette("palegreen", as_cmap=True)
sns.kdeplot(x, y, cmap=cmap);
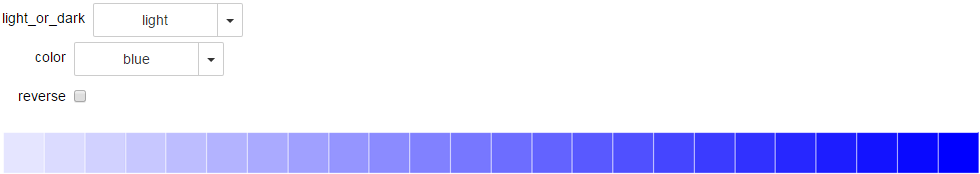
Jupyterで、インタラクティブに確認できるようにしました。
def show_pal3(light_or_dark, color, reverse):
    sns.palplot(eval('sns.%s_palette'%light_or_dark)(color=color, n_colors=24, reverse=reverse))
interact(show_pal3, light_or_dark=('light', 'dark'), color=('blue', 'navy', 'green', 'palegreen', 'red'), reverse=False);
2色に分かれたカラーパレット
(Diverging color palettes)
両端が別の色で、中間が白色のカラーパレットです。
color_paletteで指定すれば作成できます。
sns.palplot(sns.color_palette("BrBG", 24))
sns.palplot(sns.color_palette("RdBu_r", 24))
sns.palplot(sns.color_palette("coolwarm", 24))


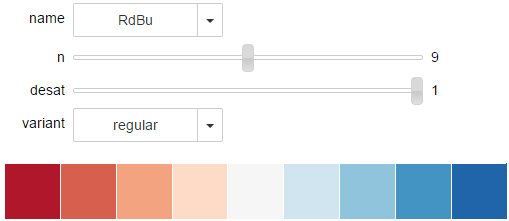
Jupyterでは、簡単に確認できます。
sns.choose_colorbrewer_palette('diverging');
2色に分かれたカスタムカラーパレット
(Custom diverging palettes with diverging_palette())
diverging_paletteでカスタムできます。
中間を暗くすることもできます。
sns.palplot(sns.diverging_palette(220, 20, n=24))
sns.palplot(sns.diverging_palette(145, 280, s=85, l=25, n=24))
sns.palplot(sns.diverging_palette(255, 133, l=60, n=24, center="dark"))


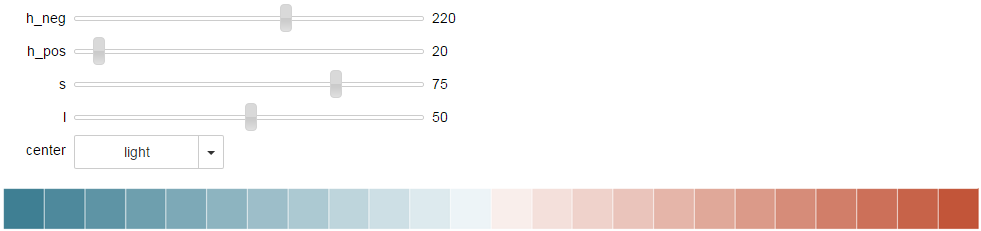
Jupyterで、インタラクティブに確認できるようにしました。
def show_pal4(h_neg, h_pos, s, l, center):
    sns.palplot(sns.diverging_palette(h_neg, h_pos, n=24, s=s, l=l, center=center))
interact(show_pal4, h_neg=FloatSlider(220, max=360), h_pos=FloatSlider(20, max=360),
         s=FloatSlider(75, max=99), l=FloatSlider(50, max=99), center=('light', 'dark'));
デフォルトカラーパレットの設定
(Changing default palettes with set_palette())
set_paletteでデフォルトカラーパレットを設定できます。
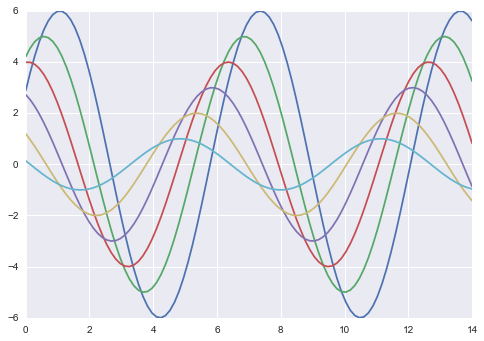
設定なしで描画します。
def sinplot(flip=1):
    x = np.linspace(0, 14, 100)
    for i in range(1, 7):
        plt.plot(x, np.sin(x + i * .5) * (7 - i) * flip)

sinplot()
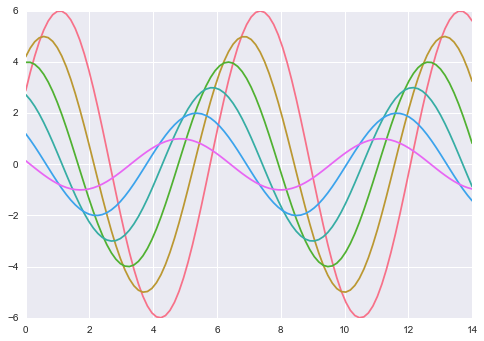
設定して描画します。
sns.set_palette("husl")
sinplot()
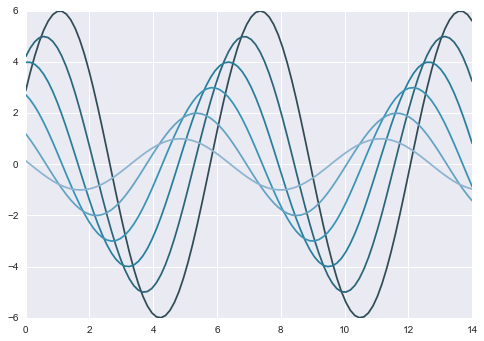
with句を使うと、局所的に変更できます。
with sns.color_palette("PuBuGn_d"):
    sinplot()
以上