Scikit learnのチュートリアルを参考にしながら、SVMを使った手書き文字の認識と結果の可視化をPythonで実装してみた。
使用するデータ
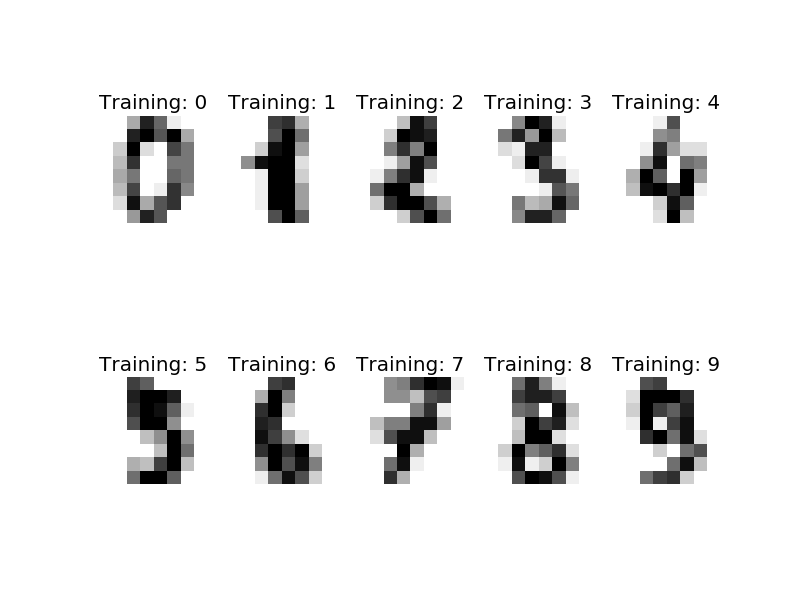
Scikit learn のライブラリに含まれているdigitsデータを使う。中身を見ると、64(=8x8)ピクセル、グレイスケールの手書き数字の画像データ、1797個分が行列形式で準備されている。これをSVMを使って多クラス分類する。
# Load example data
from sklearn import datasets
digits = datasets.load_digits()
# データフォーマットの確認
print(digits.data)
print(digits.data.shape)
n_samples = len(digits.data) # データ数
print(n_samples)

# 画像にして出力
import matplotlib.pyplot as plt
images_and_labels = list(zip(digits.images, digits.target))
for index, (image, label) in enumerate(images_and_labels[:10]):
    plt.subplot(2, 5, index + 1)
    plt.imshow(image, cmap=plt.cm.gray_r, interpolation='nearest')
    plt.axis('off')
    plt.title('Training: %i' % label)
plt.show()
[[  0.   0.   5. ...,   0.   0.   0.]
 [  0.   0.   0. ...,  10.   0.   0.]
 [  0.   0.   0. ...,  16.   9.   0.]
 ...,
 [  0.   0.   1. ...,   6.   0.   0.]
 [  0.   0.   2. ...,  12.   0.   0.]
 [  0.   0.  10. ...,  12.   1.   0.]]
(1797, 64)
1797
ハイパーパラメータの設定
分類器にはSupport Vector Machineを使う。ここでは、γ(ガンマ)とC、2つのハイパーパラメータを指定。Cはどれだけ誤分類を許容するかのパラメータ。小さいほど誤分類を許容するようになる(soft margin)。γはRBFカーネル(ガウシアンカーネル)のパラメータ。γが大きいほど、境界が複雑になる。トレーニングには、1797個のうち、前半の60%のデータを使う。残りの40%は検証用に。digits.targetには、各画像の正解データ(数字)が格納されている。
# Import support vector machine
from sklearn import svm
clf = svm.SVC(gamma=0.001, C=100.)
# train SVM
clf.fit(digits.data[:n_samples * 6 / 10 ], digits.target[:n_samples * 6 / 10])
実行結果に対する出力。一瞬で終わります。
SVC(C=100.0, cache_size=200, class_weight=None, coef0=0.0,
  decision_function_shape=None, degree=3, gamma=0.001, kernel='rbf',
  max_iter=-1, probability=False, random_state=None, shrinking=True,
  tol=0.001, verbose=False)
結果の可視化
識別器が正しく学習されているか、簡易チェック。正しく分類できていそう。
# Quick check with last ten data set:
print(digits.target[-10:]) # 正解ラベル
print(clf.predict(digits.data[-10:])) # 予測ラベル
[5 4 8 8 4 9 0 8 9 8]
array([5, 4, 8, 8, 4, 9, 0, 8, 9, 8])
各ラベルに対する正答率や、f値などを算出します。
# Predict the value of the digit on the last 40% data set:
expected = digits.target[n_samples * -4 / 10:] # 正解ラベル
predicted = clf.predict(digits.data[n_samples * -4 / 10:]) # 予測ラベル
from sklearn import metrics
print("Classification report for classifier %s:\n%s\n"
      % (clf, metrics.classification_report(expected, predicted)))
print("Confusion matrix:\n%s" % metrics.confusion_matrix(expected, predicted))
こんな結果が出力される。便利すぎる。。。
Classification report for classifier SVC(C=100.0, cache_size=200, class_weight=None, coef0=0.0,
  decision_function_shape=None, degree=3, gamma=0.001, kernel='rbf',
  max_iter=-1, probability=False, random_state=None, shrinking=True,
  tol=0.001, verbose=False):
             precision    recall  f1-score   support

          0       0.99      0.99      0.99        71
          1       0.99      0.96      0.97        73
          2       0.99      0.97      0.98        71
          3       0.97      0.86      0.91        74
          4       0.99      0.96      0.97        74
          5       0.95      0.99      0.97        71
          6       0.99      0.99      0.99        74
          7       0.96      1.00      0.98        72
          8       0.92      1.00      0.96        68
          9       0.96      0.97      0.97        71

avg / total       0.97      0.97      0.97       719


Confusion matrix:
[[70  0  0  0  1  0  0  0  0  0]
 [ 0 70  1  0  0  0  0  0  2  0]
 [ 1  0 69  1  0  0  0  0  0  0]
 [ 0  0  0 64  0  3  0  3  4  0]
 [ 0  0  0  0 71  0  0  0  0  3]
 [ 0  0  0  0  0 70  1  0  0  0]
 [ 0  1  0  0  0  0 73  0  0  0]
 [ 0  0  0  0  0  0  0 72  0  0]
 [ 0  0  0  0  0  0  0  0 68  0]
 [ 0  0  0  1  0  1  0  0  0 69]]
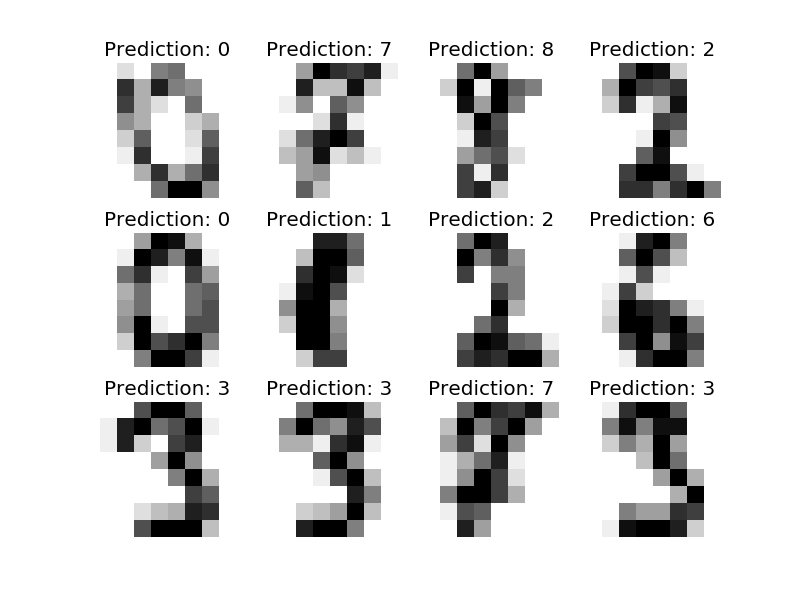
元データと予測結果の一部を画像にして出力するとこんな感じ。
images_and_predictions = list(zip(digits.images[n_samples * -4 / 10:], predicted))
for index, (image, prediction) in enumerate(images_and_predictions[:12]):
    plt.subplot(3, 4, index + 1)
    plt.axis('off')
    plt.imshow(image, cmap=plt.cm.gray_r, interpolation='nearest')
    plt.title('Prediction: %i' % prediction)
plt.show()

