概要
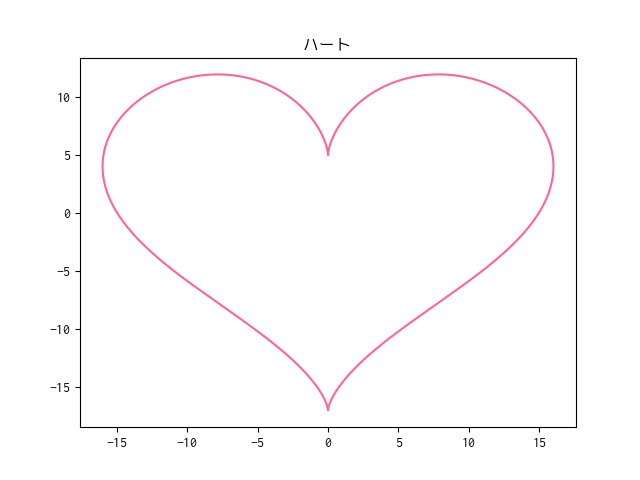
Pythonからはじめる数学入門 という書籍を買いました。せっかくなので「2 章 データをグラフで可視化する」を参考にしながら、何かグラフを描画してみようと思い立ちました。かわいい図形がよかったので ![]() を描画してみることにしました。
を描画してみることにしました。
まず前準備として matplotlib の設定ファイルを作成します。macOS の環境でグラフを表示するために backend、そしてグラフのタイトルに日本語を使うために font.family の指定が必要でした。
backend : TkAgg
font.family : Ricty Diminished
では本題の ![]() の描画に移ります。Heart Curve というページに載っている数式を利用しました。
の描画に移ります。Heart Curve というページに載っている数式を利用しました。
$x = 16sin^3(t)$
$y = 13cos(t)-5cos(2t)-2cos(3t)-cos(4t)$
from matplotlib import pyplot as plt
from math import pi, sin, cos


def draw_graph(x, y, title, color):
  plt.title(title)
  plt.plot(x, y, color=color)
  plt.show()


# range() 関数の浮動小数点数バージョン
# (参考) Pythonからはじめる数学入門 2.4.2.1 等間隔浮動小数点数の生成
def frange(start, final, increment=0.01):
  numbers = []

  while start < final:
    numbers.append(start)
    start = start + increment

  return numbers


def draw_heart():
  intervals = frange(0, 2 * pi)
  x = []
  y = []

  for t in intervals:
    x.append(16 * sin(t) ** 3)
    y.append(13 * cos(t) - 5 * cos(2 * t) - 2 * cos(3 * t) - cos(4 * t))

  draw_graph(x, y, title='ハート', color='#FF6597')


if __name__ == '__main__':
  try:
    draw_heart()
  except KeyboardInterrupt:
    # control + C で終了する。
    pass
この Python スクリプトを実行すると、美しい ![]() のグラフが描画されます。かわいい
のグラフが描画されます。かわいい ![]()
おまけ
前述のスクリプトで実装した frange 関数は NumPy の arange 関数に置き換えることができました。NumPy には pi や sin, cos などの関数も備わっているので、このモジュールを使う場合は math モジュールも不要ですね。
from matplotlib import pyplot as plt
from numpy import arange, pi, sin, cos


def draw_graph(x, y, title, color):
  plt.title(title)
  plt.plot(x, y, color=color)
  plt.show()


def draw_heart():
  intervals = arange(0, 2 * pi, 0.01)
  x = []
  y = []

  for t in intervals:
    x.append(16 * sin(t) ** 3)
    y.append(13 * cos(t) - 5 * cos(2 * t) - 2 * cos(3 * t) - cos(4 * t))

  draw_graph(x, y, title='ハート', color='#FF6597')


if __name__ == '__main__':
  try:
    draw_heart()
  except KeyboardInterrupt:
    pass
