はじめに
インターネットでソートアルゴリズムについて調べていると、アルゴリズムの動作を可視化するアニメーションをよく見かけます。自分でもこういうアニメーションを作れたら面白いなと思ったので matplotlib を使ってやってみました。
前提
- ImageMagick がインストールされていること。
- matplotlib がインストールされていること。
ソースコード
バブルソート の動作を gif アニメーションに出力するコードです。
import matplotlib.pyplot as plt
import matplotlib.animation as ani
from random import shuffle
COLOR_PINK = '#ffc0cb'
COLOR_GOSSIP = '#cbffc0'
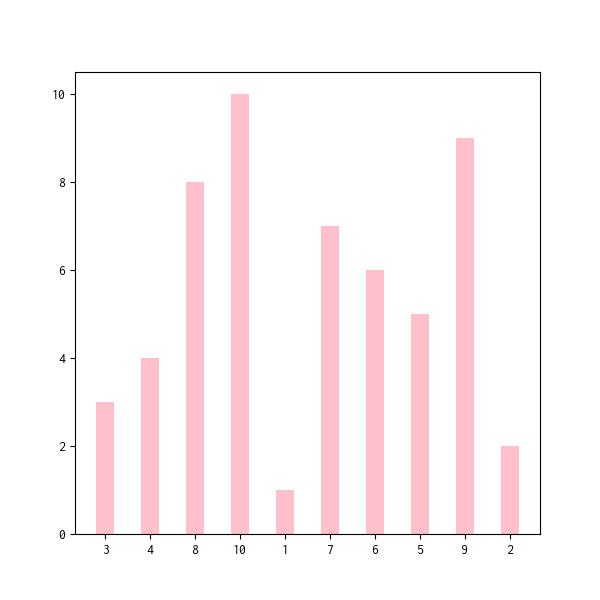
def draw_bar(li, color=COLOR_PINK):
x_axis = list(range(1, len(li) + 1))
plt.bar(x_axis, li,
tick_label=li, align='center', width=0.4, color=color)
def draw_frame(frame, sorted_li, steps):
plt.clf()
li = steps[frame]
options = {'color': COLOR_GOSSIP} if li == sorted_li else {}
draw_bar(steps[frame], **options)
def bubble_sort(li):
sorted_li = list(li)
steps = []
for i in range(0, len(sorted_li)):
for j in range(1, len(sorted_li) - i):
if sorted_li[j - 1] > sorted_li[j]:
sorted_li[j], sorted_li[j - 1] = sorted_li[j - 1], sorted_li[j]
if len(steps) == 0 or steps[-1] != sorted_li:
steps.append(list(sorted_li))
return sorted_li, steps
if __name__ == '__main__':
li = list(range(1, 11))
shuffle(li)
sorted_li, steps = bubble_sort(li)
fig = plt.figure(figsize=(6.0, 6.0))
# アニメーション中でソート結果が 5 フレーム分余計に長く表示されるようにする。
# FuncAnimation() には repeat_delay オプションがあるがこれが効かないため。
steps = steps + [steps[-1]] * 5
anim = ani.FuncAnimation(fig, draw_frame,
fargs=(sorted_li, steps), frames=len(steps))
anim.save('bubble_sort.gif', writer='imagemagick', fps=5)
アニメーション