1.Actuatorのお話
45. Endpoints
にあるように、デフォルトでステータス確認画面とか色々用意してくれています。
http://localhost:8080/actuator
みたいな感じで上記ページのIDがURLにマッピングされます。
{[/env],methods=[GET]}" onto public java.lang.Object org.springframework.boot.actuate.endpoint.mvc.EndpointMvcAdapter.invoke()
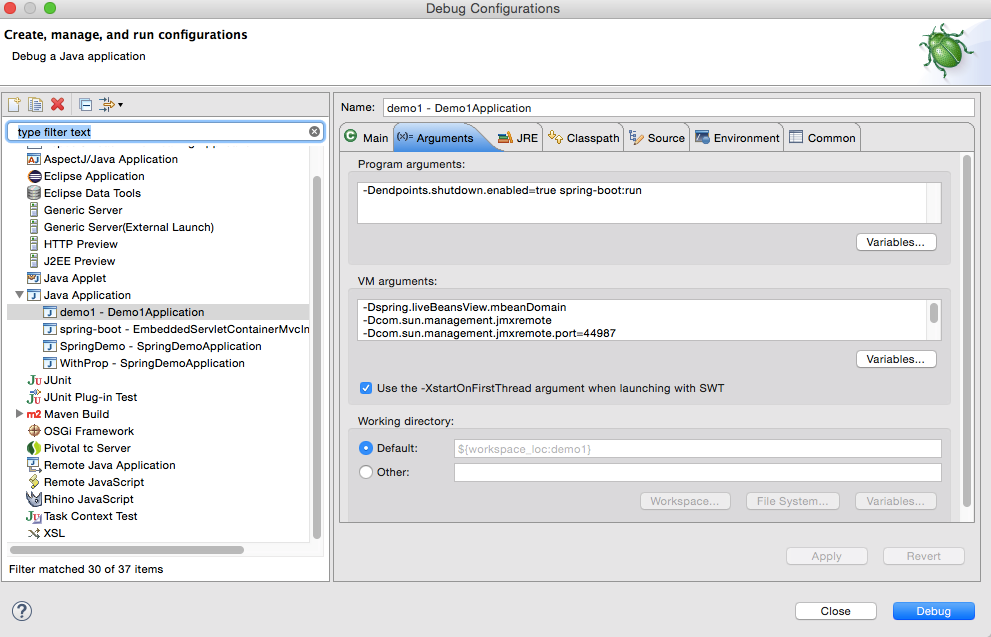
2.設定
プロパティファイルで指定する方法と起動じの引数で設定する方法と2つあります。
基本的に見えちゃいけない情報なので後者を推奨します。
endpoints.shutdown.enabled=true
3.エンドポイントの説明
trace
デフォルトでは直近数件のアクセスログを表示してくれます
ログをチェックしなくてもHTTPヘッダとか表示してくれるので便利です
{
 timestamp: 1445665963262,
 info: {
   method: "GET",
   path: "/info",
   headers: {
    request: {
      host: "localhost:8080",
      connection: "keep-alive",
      cache-control: "max-age=0",
      accept: "text/html,application/xhtml+xml,application/xml;q=0.9,image/webp,*/*;q=0.8",
      upgrade-insecure-requests: "1",
      user-agent: "Mozilla/5.0 (Macintosh; Intel Mac OS X 10_10_4) AppleWebKit/537.36 (KHTML, like Gecko) Chrome/45.0.2454.85 Safari/537.36",
      accept-encoding: "gzip, deflate, sdch",
      accept-language: "ja,en-US;q=0.8,en;q=0.6",
      cookie: "SESSION=c1fca4cc-e95c-428d-a25e-14c67f626145"
    },
    response: {
      X-Application-Context: ""MyApp dev";:dev",
      Content-Type: "application/json;charset=UTF-8",
      Transfer-Encoding: "chunked",
      Date: "Sat, 24 Oct 2015 05:52:43 GMT",
      status: "200"
    }
  }
}
metrics
これは便利かつ一番必要な情報かと思われます
こちらも任意のカスタマイズができるみたいです
http://docs.spring.io/spring-boot/docs/current/reference/html/production-ready-metrics.html
{
   mem: 519168,
   mem.free: 228519,
   processors: 4,
   instance.uptime: 182059,
   uptime: 192843,
   systemload.average: 2.3408203125,
   heap.committed: 519168,
   heap.init: 131072,
   heap.used: 290648,
   heap: 1864192,
   threads.peak: 28,
   threads.daemon: 24,
   threads: 28,
   classes: 7515,
   classes.loaded: 7516,
   classes.unloaded: 1,
   gc.ps_scavenge.count: 11,
   gc.ps_scavenge.time: 162,
   gc.ps_marksweep.count: 2,
   gc.ps_marksweep.time: 171,
   httpsessions.max: -1,
   httpsessions.active: 0,
   counter.status.200.info: 1,
   counter.status.200.metrics: 1,
   counter.status.404.star-star: 3,
   gauge.response.info: 151,
   gauge.response.metrics: 30,
   gauge.response.star-star: 13
}
env
環境変数の値を全部表示してくれますので、色々なチェックに役立ちそうです。
{
  profiles: [ ],
  commandLineArgs: { },
  servletContextInitParams: { },
  systemProperties: {
    com.sun.management.jmxremote.authenticate: "false",
    java.runtime.name: "Java(TM) SE Runtime Environment",
    sun.boot.library.path: "/Library/Java/JavaVirtualMachines/jdk1.8.0_31.jdk/Contents/Home/jre/lib",
   java.vm.version: "25.31-b07",
   gopherProxySet: "false",
   .........
mappings
これはいいです
paramsの値が入っていないのが気になりますが、このままマニュアル作れそうです
{
     [/myauth],methods=[GET],params=[],headers=[],consumes=[],produces=[],custom=[]}: {
       bean: "requestMappingHandlerMapping",
       method: "public java.lang.String demo.controller.AuthController.helloFacebook(org.springframework.ui.Model)"
     }
}
configprops
@ConfigurationPropertiesで指定されるプロパティの一覧を表示。
トムキャットの設定も見れます。
{
serverProperties: {
  prefix: "server",
  properties: {
  address: null,
  undertow: {
     bufferSize: null,
     buffersPerRegion: null,
     ioThreads: null,
     workerThreads: null,
     directBuffers: null
  },
  port: null,
  tomcat: {
     accessLogPattern: null,
     accessLogEnabled: false,
     internalProxies: "10\.\d{1,3}\.\d{1,3}\.\d{1,3}|192\.168\.\d{1,3}\.\d{1,3}|169\.254\.\d{1,3}\.\d{1,3}|127\.\d{1,3}\.\d{1,3}\.\d{1,3}",
     protocolHeader: null,
     protocolHeaderHttpsValue: "https",
     portHeader: null,
     remoteIpHeader: null,
     basedir: null,
     backgroundProcessorDelay: 30,
     maxThreads: 0,
     maxHttpHeaderSize: 0,
     uriEncoding: null,
     compression: "off",
     compressableMimeTypes: "text/html,text/xml,text/plain"
   },
   servletPath: "/",
   contextPath: null,
   sessionTimeout: null,
   ssl: null
 }
}
info
任意でいろいろ表示されられます
@Configuration
public class WebConfig extends WebMvcConfigurerAdapter {

	@Bean
	public InfoEndpoint infoEndpoint() {
	     final LinkedHashMap<String, Object> map = new LinkedHashMap<String, Object>();
	     map.put("test", "value"); //put whatever other values you need here
	     return new InfoEndpoint(map);
	}

}
{
   test: "value"
}
beans
アプリ内で動いている全てのBeanが確認できます
依存関係とかも確認できるんですが、Beanには@Orderで指定できる実行順序があるのでそれも確認したかったなあ
間違えて同じbeanを2回登録してハマることとかあるので
[
 {
   context: "application",
   parent: null,
   beans: [
   {
    bean: "demo1Application",
    scope: "singleton",
    type: "com.example.Demo1Application$$EnhancerBySpringCGLIB$$1a2a6d95",
    resource: "null",
    dependencies: [ ]
   }.....
dump
サーバー内で動いているスレッドの一覧をダンプしてくれます
これサーバーのチューニングに使えそうなのですが味方が不明です
[
  {
  threadName: "http-nio-8080-exec-10",
  threadId: 35,
  blockedTime: -1,
  blockedCount: 0,
  waitedTime: -1,
  waitedCount: 1,
  lockName: "java.util.concurrent.locks.AbstractQueuedSynchronizer$ConditionObject@503eb854",
  lockOwnerId: -1,
  lockOwnerName: null,
  inNative: false,
  suspended: false,
  threadState: "WAITING",
  stackTrace: [.......]
  }
  .......
]
health
サーバーのステータス確認ですね
こちらはHealthIndicator継承したクラスを利用することでフォーマットを自由に変更できます
{
  status: "UP"
}
autoconfig
autoconfig時のレポート表示をしてくれます
autoconfigされなかったbeanのエラーなどチェックできます
{
 positiveMatches: {}, //自動設定された
 negativeMatches: {}  //自動設定されなかった
}