過去記事まとめ
はじめに
今回は原書4章の数値微分の部分を実装します。
CNNを実装する上ではこの部分は飛ばしても構いません。Torchを用いたグラフ描写の参考程度としていただければと思います。
スクリプトは以下の通りです。
gradient_1.lua
require 'gnuplot'

---数値微分関数.
-- 入力値に対する一変数関数の数値微分を求める
-- @param f 一変数関数 (Type:function)
-- @param x 入力値 (Type:Tensor)
-- @return 入力値に対する数値微分の値 (Type:Tensor)
function numerical_diff(f, x)
    local h = 1e-4 -- 0.0001
    return (f(x+h) - f(x-h)) / (2*h)
end

---(0.01x^2+0.1x)一変数関数.
-- @param x 入力値 (Type:Tensor)
-- @return 出力値 (Type:Tensor)
function function_1(x)
    return 0.01*torch.pow(x,2) + 0.1*x
end

---接線生成関数.
-- 入力値に対する関数の接線関数を求める
-- @param f 一変数関数 (Type:function)
-- @param x 入力値 (Type:number)
-- @return 接線関数 (Type:function)
function tangent_line(f, x)
    d = numerical_diff(f, x)
    print(d)
    y = f(x) - d*x
    return function(t) return d*t + y end
end

--function_1(x)のグラフを描写
local x = torch.range(0.0, 20.0, 0.1)
local y = function_1(x)
gnuplot.figure(1)
gnuplot.axis({torch.min(x), torch.max(x), torch.min(y), torch.max(y)})
gnuplot.xlabel("x")
gnuplot.ylabel("f(x)")
gnuplot.plot({x, y, '-'})

--数値微分の値
print(numerical_diff(function_1, torch.Tensor({5})))
print(numerical_diff(function_1, torch.Tensor({10})))

--接線のグラフ描写
--x=5の場合
local function_t1 = tangent_line(function_1, 5)
local L_5 = function_t1(x)
gnuplot.figure(2)
gnuplot.axis({torch.min(x), torch.max(x), torch.min(y), torch.max(y)})
gnuplot.xlabel("x")
gnuplot.ylabel("f(x)")
gnuplot.plot({x, y, '-'},{x, L_5, '-'},{torch.Tensor({5}), function_t1(torch.Tensor({5})), '+'})
--x=10の場合
local function_t2 = tangent_line(function_1, 10)
local L_10 = function_t2(x)
gnuplot.figure(3)
gnuplot.axis({torch.min(x), torch.max(x), torch.min(y), torch.max(y)})
gnuplot.xlabel("x")
gnuplot.ylabel("f(x)")
gnuplot.plot({x, y, '-'},{x, L_10, '-'},{torch.Tensor({10}), function_t1(torch.Tensor({10})), '+'})
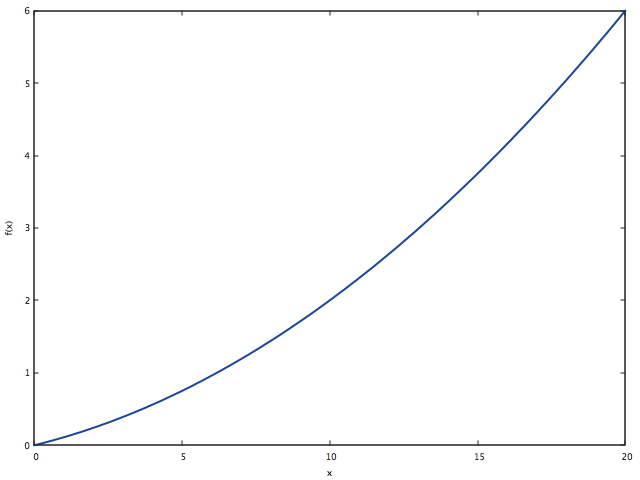
グラフの説明に関しては公式のマニュアルの説明がすごくわかりやすいです。
実行結果は以下の通りです。
実行結果
$ th gradient_1.lua
 0.2000
[torch.DoubleTensor of size 1]

 0.3000
[torch.DoubleTensor of size 1]

0.19999999999909
0.29999999999863
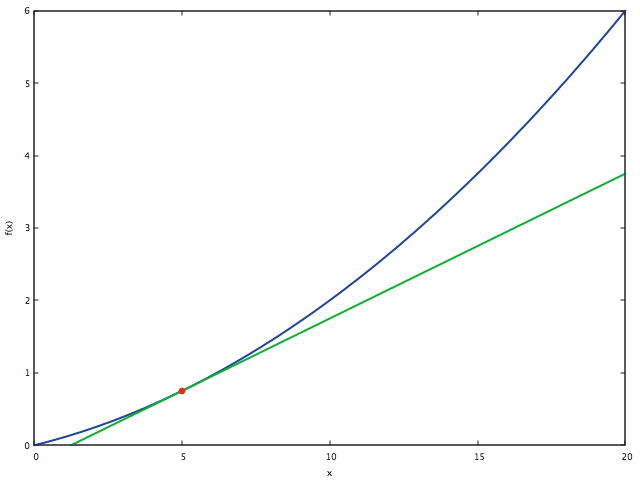
f(x) = 0.01x^2 + 0.1xのグラフとx=5での接線

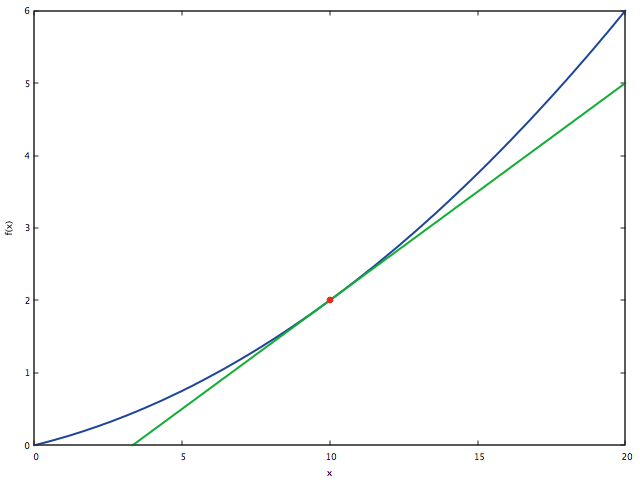
f(x) = 0.01x^2 + 0.1xのグラフとx=10での接線
おわりに
今回は以上です。
次回は偏微分の場合をみていきたいと思います。
ありがとうございました。

