動機
文献を読んでいる中で、とある2変数についての散布図とその回帰直線が示された図を見つけた。見た目では明らかにばらつきのある2つの変数に関して"弱い相関がある"という記述。実際、2つの変数の相関係数(の絶対値)は0.21であり、一応ルール化されている?0.20-0.40の"弱い相関"という範囲には含まれているが、なんだかなーと思って見ていた。同図では、さらに"p<0.05"の記述もあり、つまり図中の2変数について
「100回同様のサンプリングをすれば、無相関(=相関係数(の絶対値)が0.21未満)となるサンプリングの回数は5回未満であり、つまり今回の場合2つの変数は弱い相関を持っていると考えられる」
だと言っている。あまり統計は得意ではないのでこれをどう解釈すればいいのやらと考えた末、定義を眺めるよりも実際に手を動かしてみようかなと思った。
ここでは、相関係数=Pearson相関係数、t分布=Studentのt分布とする。
t値はサンプリング回数と相関係数の関数
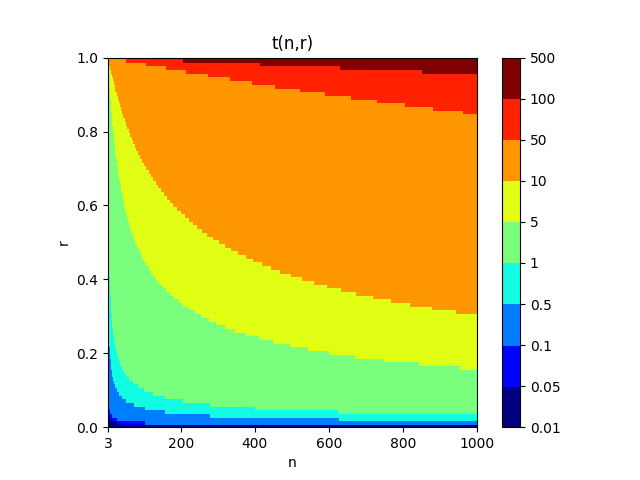
なので、これらを変動させてt値の2次元マップを図示してみた。
import numpy as np
import matplotlib.pyplot as plt
from matplotlib.colors import LogNorm
from matplotlib import colors
import matplotlib.cm as cm

nmax = 1000
n = np.linspace(3.,nmax,nmax-2)
r = np.linspace(0.,.99,100)
nn,rr = np.meshgrid(n,r)
t = rr * np.sqrt(nn - 2.) / np.sqrt(1. - rr**2)
fig = plt.figure()
ax = fig.add_subplot(111)
norm= np.array([1e-2,5e-2,1e-1,5e-1,1,5,10,50,100,500])
norml = colors.BoundaryNorm(norm,256)
cax = ax.imshow(t[::-1],cmap=cm.jet,interpolation='nearest', norm=norml)
cbar = fig.colorbar(cax,ticks=[1e-2,5e-2,1e-1,5e-1,1,5,10,50,100,500])
cbar.ax.set_yticklabels(map(str,[1e-2,5e-2,1e-1,5e-1,1,5,10,50,100,500]))
ax.set_aspect(nmax / 100.)
ax.set_xlabel('n')
xticks = [ int(nmax * 0.2 * i) - 3 for i in range(1, 6) ]
xticks.insert(0, 0)
ax.set_xticks(xticks)
xticklabels = [ int(nmax * 0.2 * i) for i in range(1, 6) ]
xticklabels.insert(0, 3)
ax.set_xticklabels( map(str, xticklabels ) )
ax.set_ylabel('r')
ax.set_yticks(np.linspace(0,100,6)-1)
ax.set_ylim(np.array([len(r),0])-1)
ax.set_yticklabels(map(str,np.linspace(1.,0.,6)))
ax.set_title('t(n,r)')
plt.show()
横軸がサンプリング回数n、縦軸が相関係数r。色の変化のスケールは対数を用いた。サンプリング数が増えるほど、相関係数が高くなるほど、t値が大きくなることが分かる。
p値(帰無仮説(無相関)を満たす確率)への変換
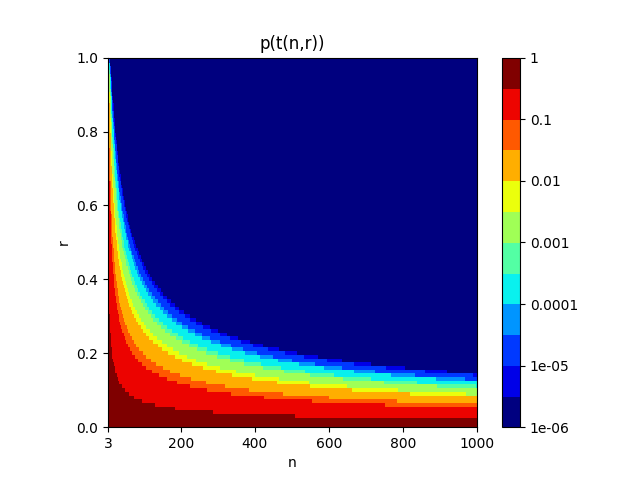
コードの土台はほぼ同じであり、scipy.statモジュールにあるt分布の累積密度関数を用いて変換した。上で求めたt値が自由度n-2のt分布に従うと仮定し、その分布でのパーセンタイルを累積密度分布から求める。ここで求められるのは負の無限大からのパーセンタイルであるため、1から値を引き、2倍してp値を得る。
import numpy as np
from scipy import stats
import matplotlib.pyplot as plt
from matplotlib.colors import LogNorm
from matplotlib import colors
import matplotlib.cm as cm

n = np.linspace(3.,nmax,nmax-2)
r = np.linspace(0.,.99,100)
nn,rr = np.meshgrid(n,r)
tt = rr * np.sqrt(nn - 2.) / np.sqrt(1. - rr**2)
p = (1. - stats.t.cdf(tt, nn-2) )* 2.
fig = plt.figure()
ax = fig.add_subplot(111)
norm= np.array([1e-6,5e-6,1e-5,5e-5,1e-4,5e-4,1e-3,5e-3,1e-2,5e-2,1e-1,5e-1,1])
norml = colors.BoundaryNorm(norm,256)
cax = ax.imshow(p[::-1],cmap=cm.jet,interpolation='nearest', norm=norml)
cbar = fig.colorbar(cax,ticks=[1e-6,1e-5,1e-4,1e-3,1e-2,1e-1,1])
cbar.ax.set_yticklabels(map(str,[1e-6,1e-5,1e-4,1e-3,1e-2,1e-1,1]))
ax.set_aspect(nmax / 100.)
ax.set_xlabel('n')
xticks = [ int(nmax * 0.2 * i) - 3 for i in range(1, 6) ]
xticks.insert(0, 0)
ax.set_xticks(xticks)
xticklabels = [ int(nmax * 0.2 * i) for i in range(1, 6) ]
xticklabels.insert(0, 3)
ax.set_xticklabels( map(str, xticklabels ) )
ax.set_ylabel('r')
ax.set_yticks(np.linspace(0,100,6)-1)
ax.set_ylim(np.array([len(r),0])-1)
ax.set_yticklabels(map(str,np.linspace(1.,0.,6)))
ax.set_title('p(t(n,r))')
plt.show()
こちらも色のスケールに対数を用いている。p<0.05を満たす区間は薄いオレンジから右上側、p<0.01を満たす区間は黄色から右上側と解釈される。自分が文献で見たデータはサンプル数が360程度であり、p値は0.05よりも2桁以上小さくなった。この図だけから解釈すると、サンプル数が100よりも多いような条件では相関係数が0.2より大きければp<0.05を満たし、また、200よりも多いような条件では相関係数が0.2より大きければp<0.01を満たすこととなり、”相関あり”の判定がガバガバな印象を受ける。
一様乱数を用いた簡単な実験
一様乱数を2つの変数として考えてもnを増やせば低いp値をとるんじゃないかと考え、実際にn=10,100,1000の3ケースで20回ずつ2つの一様乱数の相関を見る実験をしてみた。pythonではscipy.stats.linregress(np.random.rand(n),np.random.rand(n))で2番目と3番目の出力変数が相関係数とp値にそれぞれ対応する(0番目を考慮)。
| n=10 | r | p |
|---|---|---|
| 0.294252631016 | 0.409219285445 | |
| -0.394229004032 | 0.259615940744 | |
| 0.269379133102 | 0.451663790612 | |
| -0.0665598792011 | 0.85504358996 | |
| -0.0317440896014 | 0.930629735698 | |
| -0.213055138432 | 0.554527469586 | |
| -0.491243902017 | 0.149335632713 | |
| 0.172682982509 | 0.633319978086 | |
| -0.261605740322 | 0.465319719145 | |
| 0.220716863863 | 0.540023264698 | |
| 0.352795055043 | 0.317354225726 | |
| 0.424865200589 | 0.220983359361 | |
| 0.145196541373 | 0.688994313497 | |
| 0.422917471334 | 0.223335267468 | |
| -0.497427539881 | 0.143499501024 | |
| 0.46250840094 | 0.178324631007 | |
| 0.222929528257 | 0.535862979472 | |
| 0.312646846136 | 0.379106874868 | |
| 0.640193548425 | 0.0461682039678 | |
| 0.591220107858 | 0.071847815082 |
| n=100 | r | p |
|---|---|---|
| 0.109007757486 | 0.280323240638 | |
| -0.0762029864655 | 0.451121949718 | |
| 0.0954792500005 | 0.344684679783 | |
| -0.0838726979508 | 0.40673935935 | |
| 0.19115682471 | 0.0567614904295 | |
| 0.00256521002559 | 0.979792042014 | |
| -0.17174773823 | 0.0875241454086 | |
| -0.0609030260683 | 0.547219134508 | |
| -0.283923620598 | 0.00420047166569 | |
| 0.0933553762952 | 0.35557157007 | |
| -0.0153636691992 | 0.879412485892 | |
| 0.152604852801 | 0.129581264792 | |
| 0.0352942872238 | 0.727379001804 | |
| 0.114344733924 | 0.257301892916 | |
| 0.00992404428029 | 0.921936148695 | |
| -0.0599410028737 | 0.553578077967 | |
| 0.0895689554621 | 0.375503560298 | |
| -0.119305168374 | 0.237094554274 | |
| 0.00992569907175 | 0.921923172869 | |
| 0.102701125123 | 0.309252973202 |
| n=1000 | r | p |
|---|---|---|
| -0.0605521060943 | 0.0555962074179 | |
| -0.0686160654499 | 0.0300315370399 | |
| 0.0179717406962 | 0.570271711299 | |
| -0.0160509171533 | 0.612174189784 | |
| 0.0614416038825 | 0.0520936145936 | |
| -0.0590855227889 | 0.0617978598859 | |
| 0.0241791293891 | 0.445006372902 | |
| -0.0134934334313 | 0.669972645209 | |
| 0.0161118083329 | 0.61082519033 | |
| 0.00144289965595 | 0.963651826115 | |
| -0.0732621213092 | 0.0205054630989 | |
| -0.00344266964539 | 0.91341590591 | |
| -0.0385992110398 | 0.222638519951 | |
| -0.0306269707538 | 0.333281405719 | |
| 0.00389193493481 | 0.902170191671 | |
| -0.0331178802574 | 0.295442635348 | |
| 0.063076165404 | 0.0461373373319 | |
| -0.0188801667297 | 0.550941625765 | |
| -0.0201011936155 | 0.525477541286 | |
| -0.079053456281 | 0.0123955976985 |
なるほど。そもそも無相関であればnが増えればrも0に近づくから、p値が高くなるわけではないということを理解した。上の表は偶然n=1000のケースでp<0.05の試行が多くなったものの、複数回確認してみるとそのような傾向はほとんど見られなかった。
結論として、"弱い相関"というのは全く信じられないというわけでもなさそう、といった印象。見た目が散らばっているようでもサンプルが増えれば図中で重複が生じるなどで案外相関が認められるようなものなのかもしれない。

