python or jupyter上でデータをmatplotlibで表示してマウスとか範囲指定とか値の取得といったような手動で解析したりしたいときがあります。また適当な文章ですみませんがそんな時のメモです。私は天文データとか音楽用のコードを扱うのに使っていますが、そんな感じの適当なGUIのデータ解析ツールを作りたい時に便利です。参考ページはこれです。http://matplotlib.org/users/event_handling.html
jupyterの場合は%matplotlib inlineしちゃうとできないんで、そのままか%matplotlib notebookとかしてください。
準備
import numpy as np
import pylab
import matplotlib.pyplot as plt
- マウスクリックとデータの取得
def onclick(event):
    print 'event.button=%d,  event.x=%d, event.y=%d, event.xdata=%f, \
    event.ydata=%f'%(event.button, event.x, event.y, event.xdata, event.ydata)
適当なx,y配列データを表示してみます
fig=plt.figure()
ax=fig.add_subplot(111)
ax.plot(x,y)
cid = fig.canvas.mpl_connect('button_press_event', onclick)
plt.show()
マウスで図をクリックすると
event.button=1,  event.x=234, event.y=229, event.xdata=496.774194, event.ydata=1.011211
event.button=1,  event.x=257, event.y=182, event.xdata=570.967742, event.ydata=1.005703
event.button=1,  event.x=193, event.y=135, event.xdata=364.516129, event.ydata=1.000195
event.button=3,  event.x=193, event.y=135, event.xdata=364.516129, event.ydata=1.000195
こんな感じでクリックしたボタン番号と位置を表示してくれます。左クリックだとevent.button=1で真ん中だと2、右だと3ですね。
このevent.xdataというのはxの値なので、配列の対応するindexを探して赤点でプロットし、タイトルにインデックスが表示されるようにしてみましょう。これには、その値の右側indexをだしてくれるnp.searchsortedなどがつかえます。
def oncpaint(event):
    ind=np.searchsorted(x,event.xdata)
    plt.title("You clicked index="+str(ind))
    ax.plot([x[ind]],[y[ind]],".",color="red")
    fig.canvas.draw()
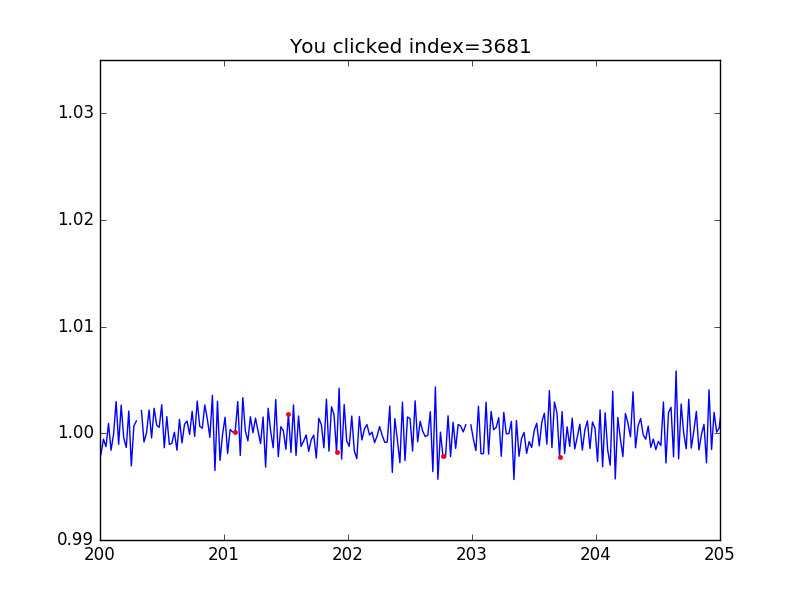
タイトルのところにclickしたindexがでてますか?基本はこんな感じでinteractiveに情報をgetできます。レゴみたいですね。さてあなたは今macを使ってますか?macってマウスがボタンが一つしかなくてオシャレを優先しすぎなかんじしませんか?そう。拡大とかいろんな操作が左クリック(event.button=1)でやるんで、自分が定義した操作はほかのボタンでやりたいんです。なので安いマウスでいいんで、以降3ボタンのものを繋ぎましょう。
次は、こんな感じのものをつくりましょう。
- 全部trueのmaskを用意する
- 右クリックで二回点を選ぶと、その2点の間がマークされる
- 左ダブルクリックで決定、真ん中ボタンでキャンセル
- 決定したマークの部分のmaskがfalseになる
全部trueのマスク
mask=np.ones(len(x),dtype=bool)
上記操作の定義部分
def oncmask(event):
    global stat
    global leftind, rightind
    ind=np.searchsorted(x,event.xdata)
    plt.title("You clicked index="+str(ind))
    if event.button==3 and stat==1:
        leftind=ind
        ax.plot([x[ind]],[y[ind]],".",color="red")
        stat=2
    elif event.button==3 and stat==2:
        rightind=ind
        ax.plot(x[leftind:rightind],y[leftind:rightind],color="red")
        stat=3
        print leftind, rightind
    elif event.button==1 and event.dblclick==1 and stat==3:
        plt.title("Approved")
        mask[leftind:rightind]=False
        stat=1
    elif event.button==2 and stat==3:
        plt.title("Canceled")
        ax.plot(x[leftind:rightind],y[leftind:rightind],color="blue")
        ax.plot([x[leftind]],[y[leftind]],".",color="green")
        stat=1
    fig.canvas.draw()
二回右クリックで領域を選んで、、、左ダブルクリックをするとApprove! 真ん中ボタン押すとやり直し。こんな感じ

じゃあmaskされたかチェックしましょう
fig=plt.figure()
ax=fig.add_subplot(111)
plt.xlim(200,205)
ax.plot(x[mask],y[mask])
plt.show()
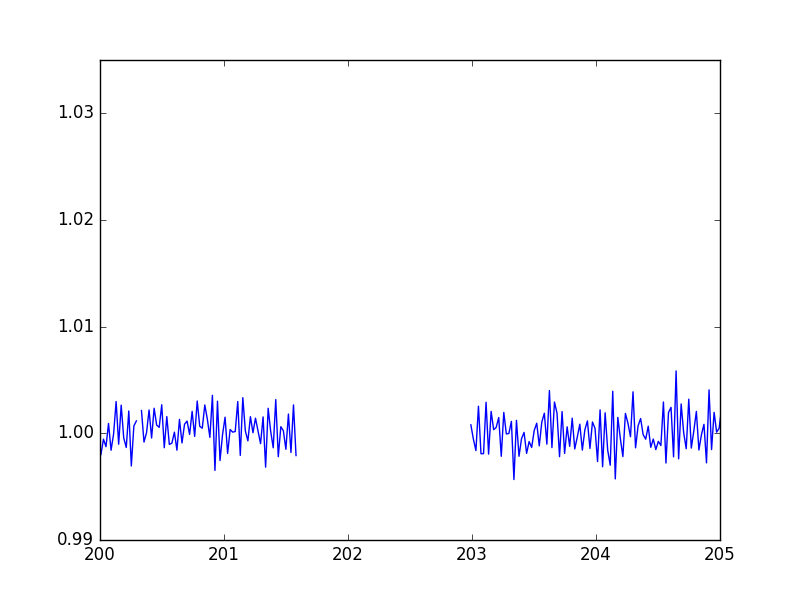
されてますね。
- キーボード値の取得
キーボード入力値も取得できます。
今回はflushで消しましょう。
import sys
定義部分。qを押したら終了するように設定しました。
def onkey(event):
    print('you pressed', event.key, event.xdata, event.ydata)
    if event.key == 'q':
        plt.close(event.canvas.figure)
    sys.stdout.flush()
図を出して、図上でキーボードをうってみてください。
fig=plt.figure()
ax=fig.add_subplot(111)
plt.xlim(200,205)
plt.title("q:quit")
ax.plot(x,y)
cid = fig.canvas.mpl_connect('key_press_event', onkey)
plt.show()
こんな感じででます。
('you pressed', u'a', 201.38104838709677, 1.0182421874999998)
('you pressed', u'b', 201.38104838709677, 1.0182421874999998)
('you pressed', u'c', 201.38104838709677, 1.0182421874999998)
('you pressed', u'shift', 201.33064516129031, 1.0173046875)
('you pressed', u'A', 201.33064516129031, 1.0173046875)
('you pressed', u'shift', 201.32056451612902, 1.0168359375)
('you pressed', u'R', 201.32056451612902, 1.0164843749999999)
('you pressed', u'q', 201.21975806451613, 1.0033593750000001)
ではでは。
追記:
def oncpaint(event):
    ind=np.searchsorted(x,event.xdata)
    ax.plot([x[ind]],[y[ind]],".",color="red")
    fig.canvas.draw()
import builtins

builtins.x=np.linspace(0,1,100)
builtins.y=np.cos(x)
builtins.fig=plt.figure()
ax=fig.add_subplot(111)
ax.plot(x,y)
cid = fig.canvas.mpl_connect('button_press_event', onclick)
plt.show()
これを別ファイルに書いてmoduleで呼び出したいときは、xとかfigを呼び出し先でbuiltinsでビルトインスコープにするといいかもしれませんね(もっと良いやり方が有ればおしえてください)。