Microsoft COCOとは

画像の認識、セグメンテーション、キャプショニングがされているデータセットです。
画像処理をしたいと思っても最初に衝突する問題がデータセットの問題ですが、Microsoft COCOには必要なデータセットが用意されており、pythonとMatlabのAPIも提供されているため、使用するのが簡単なのが特徴です。
まずは下記からデータセットをダウンロードしてください。

上記のような画面が出てきます。
画像データはサイズが大きいので、どのような分析ができるか試したいだけでしたらValidation Dataをダウンロードして試すと良いと思います。
MS COCO API
上記のデータを分析するためのAPIです。
データをダウンロードさえすればこれで自由に分析できます。
私はpythonをよく使うのでpythonで環境構築して動作を試してみました。
# API Download
git clone https://github.com/pdollar/coco
# API install
cd coco/PythonAPI
python setup.py install
フォルダ構成と準備
cocoのフォルダに下記のデレィクトリを作成し、画像とアノテーションのデータを置いておきます。
annotations
images
MatlabAPI	README.txt	images		results
PythonAPI	annotations	license.txt
PythonAPIのフォルダは下記のようになっており、ipython notebookを使用すると解析できます。
Makefile		pycocoDemo.ipynb	pycocotools
build			pycocoEvalDemo.ipynb	setup.py
ipython notebookの導入は下記を参考にしてください
画像の解析
ではいよいよ解析に入ります。
重要そうなところだけピックアップして説明していきます。
画像の読み込みと準備
dataTypeのところにtrain2014,val2014,test2014の3種類から選択します。
dataDir ='..'
dataType='val2014'
annFile='%s/annotations/instances_%s.json'%(dataDir,dataType)
下記のコードでデータのカテゴリとスーパーカテゴリが分かります。
スーパーカテゴリはカテゴリの上位概念みたいなものです。
例:
カテゴリ:犬、猫・・
スーパーカテゴリ:動物
# initialize COCO api for instance annotations
coco=COCO(annFile)
# display COCO categories and supercategories
cats = coco.loadCats(coco.getCatIds())
nms=[cat['name'] for cat in cats]
print 'COCO categories: \n\n', ' '.join(nms)

nms = set([cat['supercategory'] for cat in cats])
print 'COCO supercategories: \n', ' '.join(nms)
下記のコードでどのカテゴリのデータを選択するかを選びます。
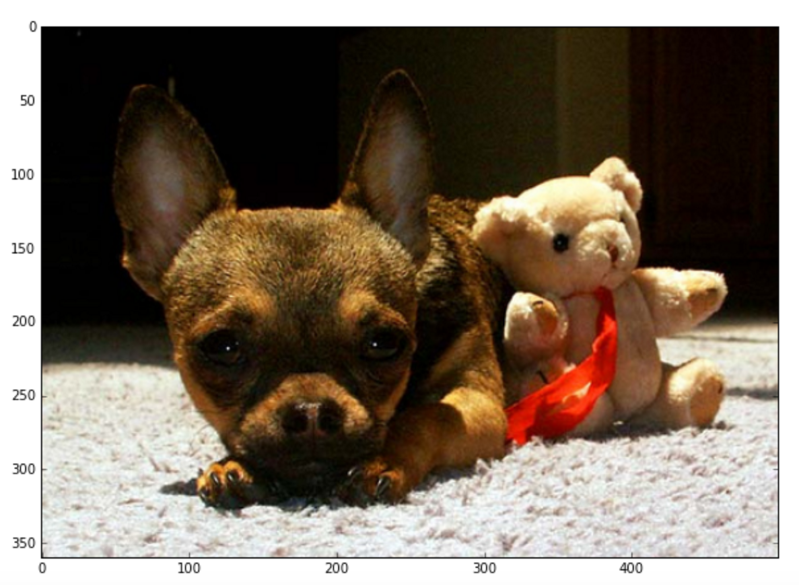
今回は"dog"を選択しています。
"dog"のカテゴリのデータからランダムに選択して読み込んでいます。
# get all images containing given categories, select one at random
catIds = coco.getCatIds(catNms=['dog']);
imgIds = coco.getImgIds(catIds=catIds );
img = coco.loadImgs(imgIds[np.random.randint(0,len(imgIds))])[0]
画像の読み込みと表示は下記で行います。
# load and display image
I = io.imread('%s/%s/%s'%(dataDirImage,dataType,img['file_name']))
plt.figure()
plt.imshow(I)
表示される画像です。
すごく癒されますね。笑
画像のフィルター
癒しの画像を解析してみます。
# load and display instance annotations
plt.imshow(I)
annIds = coco.getAnnIds(imgIds=img['id'], catIds=catIds, iscrowd=None)
anns = coco.loadAnns(annIds)
coco.showAnns(anns)
画像の犬のデータが緑になっていることが確認できます。
coco.getAnnIdsの部分でフィルターをかけています。
この関数の説明を見てみると下記のようになっています。
今回は読み込んだ画像のidをimgIds=img['id']で処理を行い、catIds=catIdsで画像のフィルタリングを行っています。
        """
        Get ann ids that satisfy given filter conditions. default skips that filter
        :param imgIds  (int array)     : get anns for given imgs
               catIds  (int array)     : get anns for given cats
               areaRng (float array)   : get anns for given area range (e.g. [0 inf])
               iscrowd (boolean)       : get anns for given crowd label (False or True)
        :return: ids (int array)       : integer array of ann ids
        """

画像のキャプション
次に画像のキャプションをみてみましょう。
画像のキャプションとは画像の説明文です。
caps.getAnnIdsで画像を指定してキャプションを取得しています。
他のコードで取得したキャプションを用いて画像とキャプションを生成しています。
# load and display caption annotations
annIds = caps.getAnnIds(imgIds=img['id']);
anns = caps.loadAnns(annIds)
caps.showAnns(anns)
plt.imshow(I)
plt.show()

キャプションの候補が複数確認できました。
キャプションは人によって解釈が異なるので複数候補がある方が助かりますね。
最後に
画像解析したくてもデータがない問題には直面しやすいと思います。
このように解析まで簡単にできるものを提供してくれているMicrosoftはさすがと言えます。
Visual Studio Codeなどオープン化が進んでいるMicrosoftの今後の活動にも注目です。
Error対応
RuntimeError: Python is not installed as a framework. The Mac OS X backend will not be able to function correctly if Python is not installed as a framework. See the Python documentation for more information on installing Python as a framework on Mac OS X. Please either reinstall Python as a framework, or try one of the other backends. If you are Working with Matplotlib in a virtual enviroment see 'Working with Matplotlib in Virtual environments' in the Matplotlib FAQ
上記のエラーの場合は~/.matplotlib/matplotlibrc に次の一行を追加する
backend : TkAgg