正規化とは?
統計解析の現場では、データフレームの各列の単位が異なる場合があります。
- 身長
- 体重
- 血圧
- etc...
その場合、各変量を平均が0、分散が1となるよう変換を加えることがあります。
これを正規化と呼びます。
Rでは関数scale()を用いることで、データフレームを正規化可能です。
正規化には2つの手順があります。
- センタリング : それぞれの変量から全体の平均を引く。平均が0となる。
- スケーリング : それぞれの変量を全体の標準偏差で割る。分散が1となる。
Rによる実例
では、Rで実例を見ていきましょう。
身長・体重・血圧の変量を作った後、melt関数で縦持ちにしてggplotでヒストグラムを描画してみます。
n = 1000
df <- data.frame(
    height = rnorm(n, 170, 10),
    weight = rnorm(n,  70, 5),
    bloodpressure = rnorm(n, 125, 2)
)

library(reshape2)
library(ggplot2)
ggplot(melt(df), aes(x=value)) +
    geom_histogram(fill="gray", binwidth=1) +
    facet_grid(variable~., scales="free")
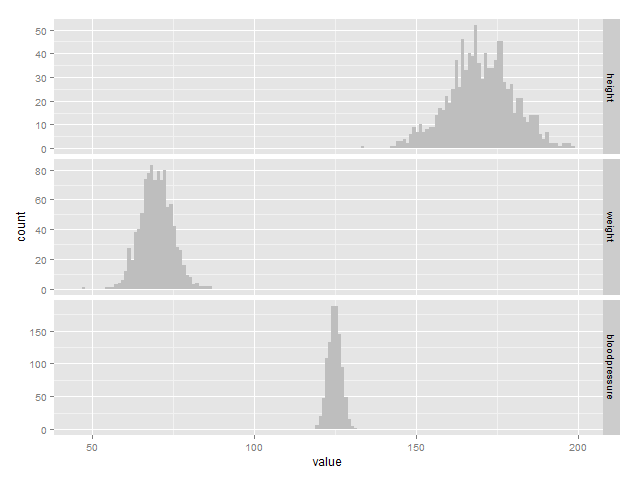
3変量が全く別の分布になっていることが分かります。
次に、これをscale関数で正規化した後、ヒストグラムにしてみます。
df.scale = scale(df)

ggplot(melt(df.scale), aes(x=value)) +
    geom_histogram(fill="gray", binwidth=0.1) +
    facet_grid(Var2~., scales="free")
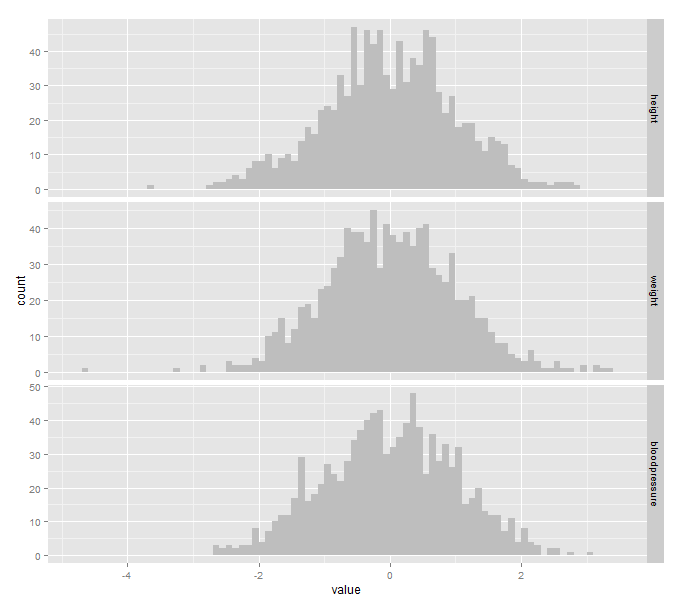
全て同じ分布になっていることが分かります。
平均と分散も見てみましょう。
> apply(df.scale, 2, function(x){
+     print(mean(x))
+     print(var(x))
+ })
[1] -3.592281e-16
[1] 1
[1] 9.214658e-16
[1] 1
[1] 2.510722e-15
[1] 1
       height        weight bloodpressure
            1             1             1
全て平均0と分散1になっています。
まとめ
- scale関数で正規化が可能