やりたいこと
確率変数$x$と$y$が、$x = g(y)$の関係になっているとします。また、$x$に関する確率密度関数$p_x(x)$は分かっているとします。
この時、$y$に関する確率密度関数$p_y(y)$の形はどうなっているかを考えます。
説明
単純に変換すると、$p_x(g(y))$となりますが、これは$x$に関する確率密度関数であるため、$p_y(y) \neq p_x(g(y))$です。
$p_x(x)$と$p_y(y)$の関係は、任意の範囲$x_1\sim x_2$に関して、
\int_{x_1}^{x_2} p_x(x) \mathrm{d}x = \int_{g^{-1}(x_1)}^{g^{-1}(x_2)} p_y(y) \mathrm{d}y
となるはずです。
ただし、$g^{-1}(x)$は、$g(x)$の逆関数です。
積分の変数変換の公式を用いると、
\begin{align}
\int_{x_1}^{x_2} p_x(x) \mathrm{d}x&=\int_{x_1}^{x_2} p_x(g(y)) \mathrm{d}x\\
&=\int_{g^{-1}(x_1)}^{g^{-1}(x_2)} p_x(g(y))\left|
\frac{\partial g(y)}{\partial y}\right| \mathrm{d}y
\end{align}
よって、
p_y(y) = p_x(g(y))\left|
\frac{\partial g(y)}{\partial y}\right|
となります。
実装
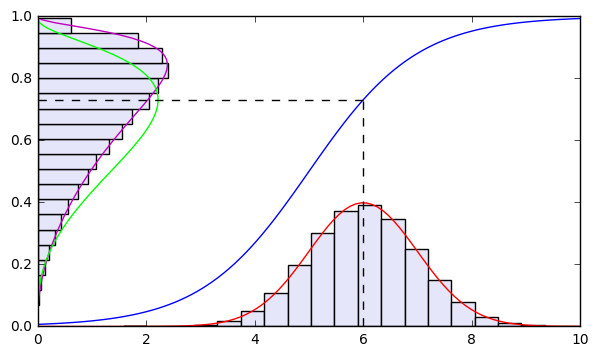
p_x(x) = \mathcal{N}(x\mid\mu,\sigma^2)\\
x = g(y) = \ln(y)-\ln(1-y)+5\\
y = g^{-1}(x) = \frac{1}{1+\exp(-x+5)}
の場合を考えます。
\frac{\partial g(y)}{\partial y} = \frac{1}{y(1-y)}
より、
p_y(y) = \mathcal{N}(g(y)\mid\mu,\sigma^2)\frac{1}{y(1-y)}
これが、$p_x(x)$からのサンプルを$y=g^{-1}(x)$で変換したデータのヒストグラムと一致するかを確認します。
コード
# !/usr/bin/env python3
# -*- coding: utf-8 -*-

import numpy as np
import matplotlib.pyplot as plt

# ガウス分布の密度関数
def gaussianDist(sig,mu,x):
    y=np.exp(-(x-mu)**2/(2*sig**2))/(np.sqrt(2*np.pi)*sig)
    return y

# 確率変数の変換関数
def g(y):
    x=np.log(y)-np.log(1-y)+5
    return x

# 確率変数の変換関数の逆関数
def invg(x):
    y=1/(1+np.exp(-x+5))
    return y

# ガウス分布px(x)の平均、分散
sig=1.0
mu=6

# ヒストグラムのサンプル数
N = 50000

plt.xlim([0,10])
plt.ylim([0,1])

####
x = np.linspace(0,10,100)

# 確率変数の変換関数をプロット
y=invg(x)
plt.plot(x,y,'b')

# px(x)のプロット
y = gaussianDist(sig,mu,x)
plt.plot(x,y,'r')

# px(x)からのサンプルを元にヒストグラムをプロット
x_sample = mu + sig * np.random.randn(N)
plt.hist(x_sample,bins=20,normed=True,color='lavender')


####
y=np.linspace(0.01,0.99,100)

## py(y)のプロット
x=gaussianDist(sig,mu,g(y))/(y*(1-y))
plt.plot(x,y,'m')

# px(x)からのサンプルをg^-1(x)で変換したデータのヒストグラムをプロット
y_sample = invg(mu + sig * np.random.randn(N))
plt.hist(y_sample,bins=20,normed=True,orientation="horizontal",color='lavender')

# px(g(y))のように単純に変換した関数をプロット
x = gaussianDist(sig,mu,g(y))
plt.plot(x/(x.sum()*0.01) ,y,'lime')

####
# 平均muとg^-1(mu)との関係をプロット
plt.plot([mu, mu], [0, invg(mu)], 'k--')
plt.plot([0, mu], [invg(mu), invg(mu)], 'k--')
