LoginSignup
0
1

More than 5 years have passed since last update.

めざせpythonライブラリマスター (44)pynetviz

Posted at

【ライブラリ説明】

 グラフが描ける

【準備】

 Anaconda2に付属のJupyter Notebookで実行しました。

【プログラム】

pynetviz.py
# -*- coding: utf-8 -*-

import networkx as nx
import pynetviz.sigmajs as nvs
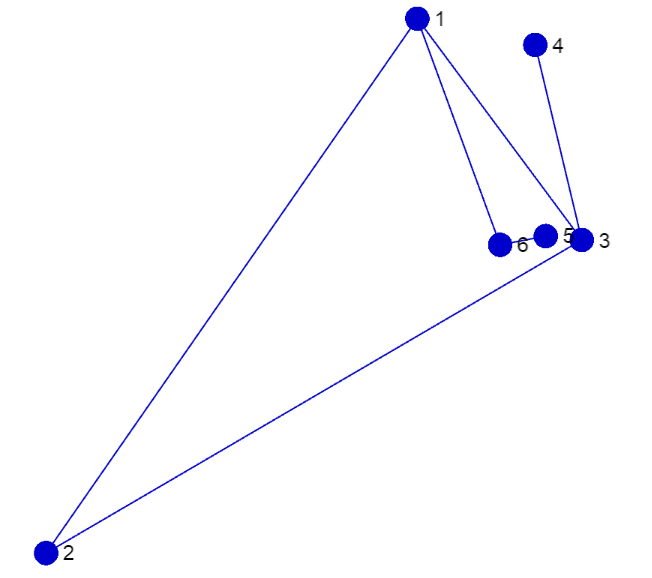
G = nx.Graph()
G.add_edges_from([(1,2),(2,3),(3,4),(5,6)])
G.add_edge(1, 3)
G.add_edge(1, 6)
nvs.make_gexf(G)
nvs.make_html(drawEdges='true')
nvs.view_html()

【結果】

graph.png

【参考サイト】

 pypi
 github

0
1
0

Register as a new user and use Qiita more conveniently

  1. You get articles that match your needs
  2. You can efficiently read back useful information
  3. You can use dark theme
What you can do with signing up
0
1