動作環境
GeForce GTX 1070 (8GB)
ASRock Z170M Pro4S [Intel Z170chipset]
Ubuntu 16.04 LTS desktop amd64
TensorFlow v1.2.1
cuDNN v5.1 for Linux
CUDA v8.0
Python 3.5.2
IPython 6.0.0 -- An enhanced Interactive Python.
gcc (Ubuntu 5.4.0-6ubuntu1~16.04.4) 5.4.0 20160609
GNU bash, version 4.3.48(1)-release (x86_64-pc-linux-gnu)
やろうとしていること
Chebyshev粒子の形状など凹凸の激しい粒子を画像化したい。
以下のような条件とする
- (x, y, z)のリストが与えられる
- リストの要素の並びは昇順や降順とは限らない
- 格子状のデータになっているとする
Povrayで昔書いたような気がするが、忘れた。
MatplotlibでMeshgridを使うと希望の可視化ができるだろうか。
code v0.1
toMeshgrid_170902.ipynb
import matplotlib.pyplot as plt
from mpl_toolkits.mplot3d import Axes3D
import numpy as np
from pylab import rcParams
import sys

'''
v0.1 Sep. 02, 2017
   - add get_meshgrid_from_xyzArray()
   - add func_z()
   - display 3D surface with lines
      + ref: https://stackoverflow.com/questions/30497737/applying-colormaps-to-custom-axis-in-matplotlib-3d-surface
'''

rcParams['figure.figsize'] = 15, 10


def func_z(x, y):
    return x ** 2 + y ** 3


def get_meshgrid_from_xyzArray(xar, yar, zar):
    # mx, my, mz : in meshgrid
    #
    xuniq = np.unique(xar)
    yuniq = np.unique(yar)
    mz = np.empty([len(yuniq), len(xuniq)])
    for ix in range(len(xuniq)):
        for iy in range(len(yuniq)):
            xx, yy = xuniq[ix], yuniq[iy]
            for idx in range(len(xar)):
                tx, ty = xar[idx], yar[idx]
                if abs(tx - xx) >= sys.float_info.epsilon:
                    continue
                if abs(ty - yy) >= sys.float_info.epsilon:
                    continue
                mz[iy][ix] = zar[idx]
    mx, my = np.meshgrid(xuniq, yuniq)
    return mx, my, mz

# X, Y grid
inx = np.linspace(-5, 5, 10, endpoint=True)
iny = np.linspace(-3, 3, 5, endpoint=True)

# make reading data (normally will be read from a file)
xls, yls, zls = [], [], []
for ix in range(len(inx)):
    for iy in range(len(iny)):
        az = func_z(inx[ix], iny[iy])
        xls.append(inx[ix])
        yls.append(iny[iy])
        zls.append(az)
xar, yar, zar = np.array(xls), np.array(yls), np.array(zls)

# 1. from linspace
gx1, gy1 = np.meshgrid(inx, iny)
gz1 = func_z(gx1, gy1)
fig = plt.figure()
ax1 = plt.subplot2grid((1, 2), (0, 0), projection='3d')
surf1 = ax1.plot_surface(gx1, gy1, gz1, shade=False,
                         facecolors=plt.cm.Set2((gx1-gx1.min())/(gx1.max()-gx1.min()))
                         )

# 2. from x,y,z arrays
res = get_meshgrid_from_xyzArray(xar, yar, zar)
gx2, gy2, gz2 = res
ax2 = plt.subplot2grid((1, 2), (0, 1), projection='3d')
surf2 = ax2.plot_surface(gx2, gy2, gz2, shade=False,
                         facecolors=plt.cm.Set2((gx2-gx2.min())/(gx2.max()-gx2.min()))                                                  )
plt.draw()

#   draw lines on the surface
lines = np.array(surf1.get_edgecolor())
# make lines white, and keep alpha==1. It's an array of colors like this: [r,g,b,alpha]
surf1.set_edgecolor(lines * np.array([0, 0, 0, 0]) + 1)
lines = np.array(surf2.get_edgecolor())
# make lines white, and keep alpha==1. It's an array of colors like this: [r,g,b,alpha]
surf2.set_edgecolor(lines * np.array([0, 0, 0, 0]) + 1)

plt.show()
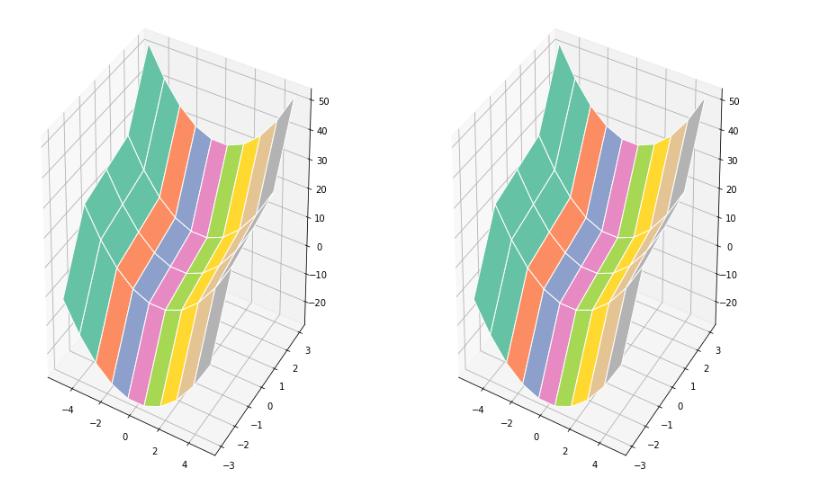
左がMeshgridそのもの。
右がx,y,zで与えられた座標データをMeshgridにしたもの。

