線形モデル(lm)を使った、線形回帰の信頼区間と予測区間を計算するスクリプト です。
説明変数1個の1次式で回帰
05_Liner_regression_by_lm.R
#-------Making data------------------------------
#Making data to make regression model
x<-iris$Petal.Length
y<-iris$Petal.Width
data_for_model <- as.data.frame(cbind(x,y))
#Making data to Prediction
data_for_prediction<-NULL
data_for_prediction$x<-seq(0, 8, 0.1)
data_for_prediction<- as.data.frame(data_for_prediction)
#-------Linear Regression by lm------------------
#Making regression model
result <- lm(y~x,data=data_for_model)
#Predction
#interval = "prediction"にするとuprとlwrが予測区間の上下限になる。
#interval = "confidence"にするとuprとlwrが信頼区間の上下限になる。
prediction<-predict(result, data_for_prediction, interval="prediction",level = 0.95)
prediction<- as.data.frame(prediction)
#-------Output Png file------------------
png("05_output.png") #Open device
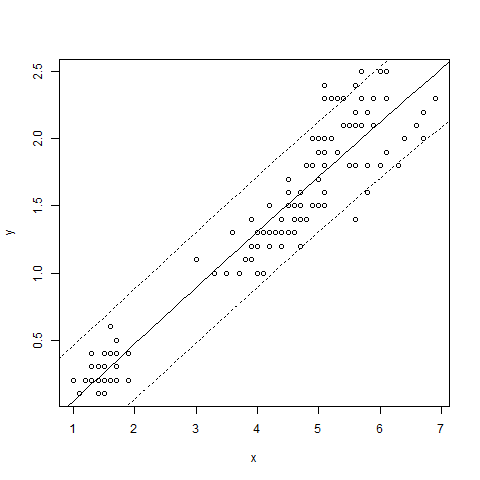
#データのプロット
plot(x,y,pch=21,col="black")
#予測値(今回は回帰直線)の描画
lines(data_for_prediction$x,prediction$fit,col="black") #Plot predction
#予測区間の描画
lines(data_for_prediction$x,prediction$upr,col="black",lty="dotted")
lines(data_for_prediction$x,prediction$lwr,col="black",lty="dotted")
dev.off() #Close device
結果
#説明変数2個の3次式で回帰
05_Liner_regression_by_lm2.R
#-------Making data------------------------------
#Making data to make regression model
x1<-iris$Petal.Length
x2<-iris$Sepal.Width
y<-iris$Petal.Width
data_for_model <- as.data.frame(cbind(x1,x2,y))
#Making data to Prediction
data_for_prediction<-NULL
data_for_prediction$x1<-seq(0, 8, length=50)
data_for_prediction$x2<-seq(1, 5, length=50)
data_for_prediction<- as.data.frame(data_for_prediction)
#-------Linear Regression by lm------------------
#Making regression model
result <- lm(y~poly(x1,x2,degree=3),data=data_for_model)
#Predction
prediction<-predict(result, data_for_prediction, interval="prediction",level = 0.95)
prediction<- as.data.frame(prediction)
#-------Output Png file------------------
png("05_output2.png") #Open device
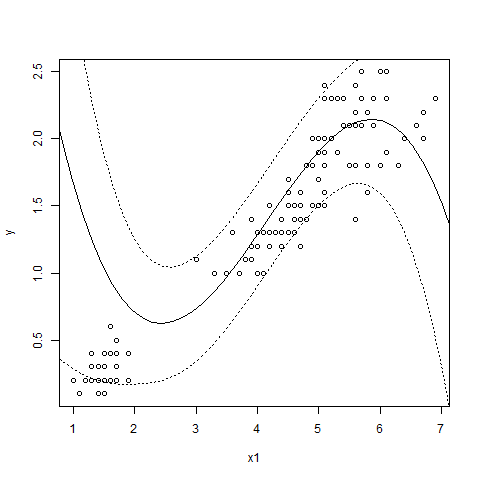
#x1 vs y
plot(x1,y,pch=21,col="black") #Plot data
lines(data_for_prediction$x1,prediction$fit,col="black") #Plot predction
lines(data_for_prediction$x1,prediction$upr,col="black",lty="dotted")
lines(data_for_prediction$x1,prediction$lwr,col="black",lty="dotted")
dev.off() #Close device
png("05_output3.png") #Open device
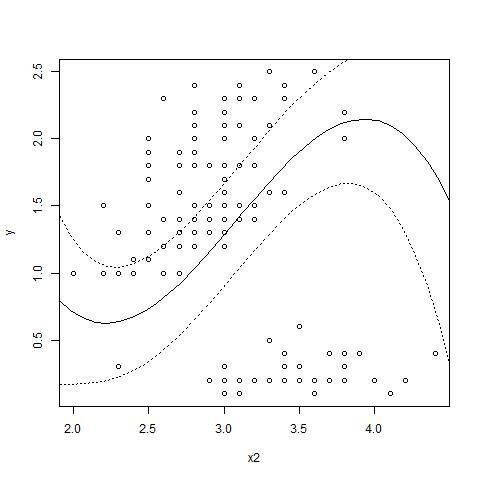
#x2 vs y
plot(x2,y,pch=21,col="black") #Plot data
lines(data_for_prediction$x2,prediction$fit,col="black") #Plot predction
lines(data_for_prediction$x2,prediction$upr,col="black",lty="dotted")
lines(data_for_prediction$x2,prediction$lwr,col="black",lty="dotted")
dev.off() #Close device
結果